Arsenal Compared to Average xG For and Against

I struggled to come up with a good title to describe how the stats I want to talk about here and while I did tweet about it, it felt like it needed something a little more and I didn't think that it made sense as a thread.
So what we are looking at here is how Arsenal has done in creating and preventing teams from creating scoring chances compared to how they have done overall.
The tl;dr story is not well.
Attack
In attack Arsenal are creating 73% of the average xG allowed for the teams that they have faced. Here is how it breaks down (all stats through GW7 if you come back and read this later), all stats from FBRef:
Brentford - AVG xGA 1.05, Arsenal created 1.5, rating 142%
Chelsea - AVG xGA 1.24, Arsenal created 0.3, rating 24%
Manchester City - AVG xGA 0.57, Arsenal created 0.1, rating 18%
Norwich City - AVG xGA 2.0, Arsenal created 3.0, rating 150%
Burnley - AVG xGA 1.61, Arsenal created 1.2, rating 74%
Tottenham - AVG xGA 1.44, Arsenal created 0.8, rating 56%
Brighton - AVG xGA 1.11, Arsenal created 0.5, rating 45%
There are some mitigating factors in some of these but it is still a major concern.
Brentford looks better in the light of how they have played other teams, but this still had some major score effects that maybe balanced out the missing players from Arsenal.
Manchester City had the red card, but also had just the one shot and almost no threat before that. It would probably look slightly better if it finished 11 v 11 but still probably ugly.
Burnley had some chances to create shots from the break that didn't come off, but also not executing is a problem for Arsenal. Tottenham had 3 early goals from 2 good chances and a decent one and then Arsenal pretty much saw out the end of the match.
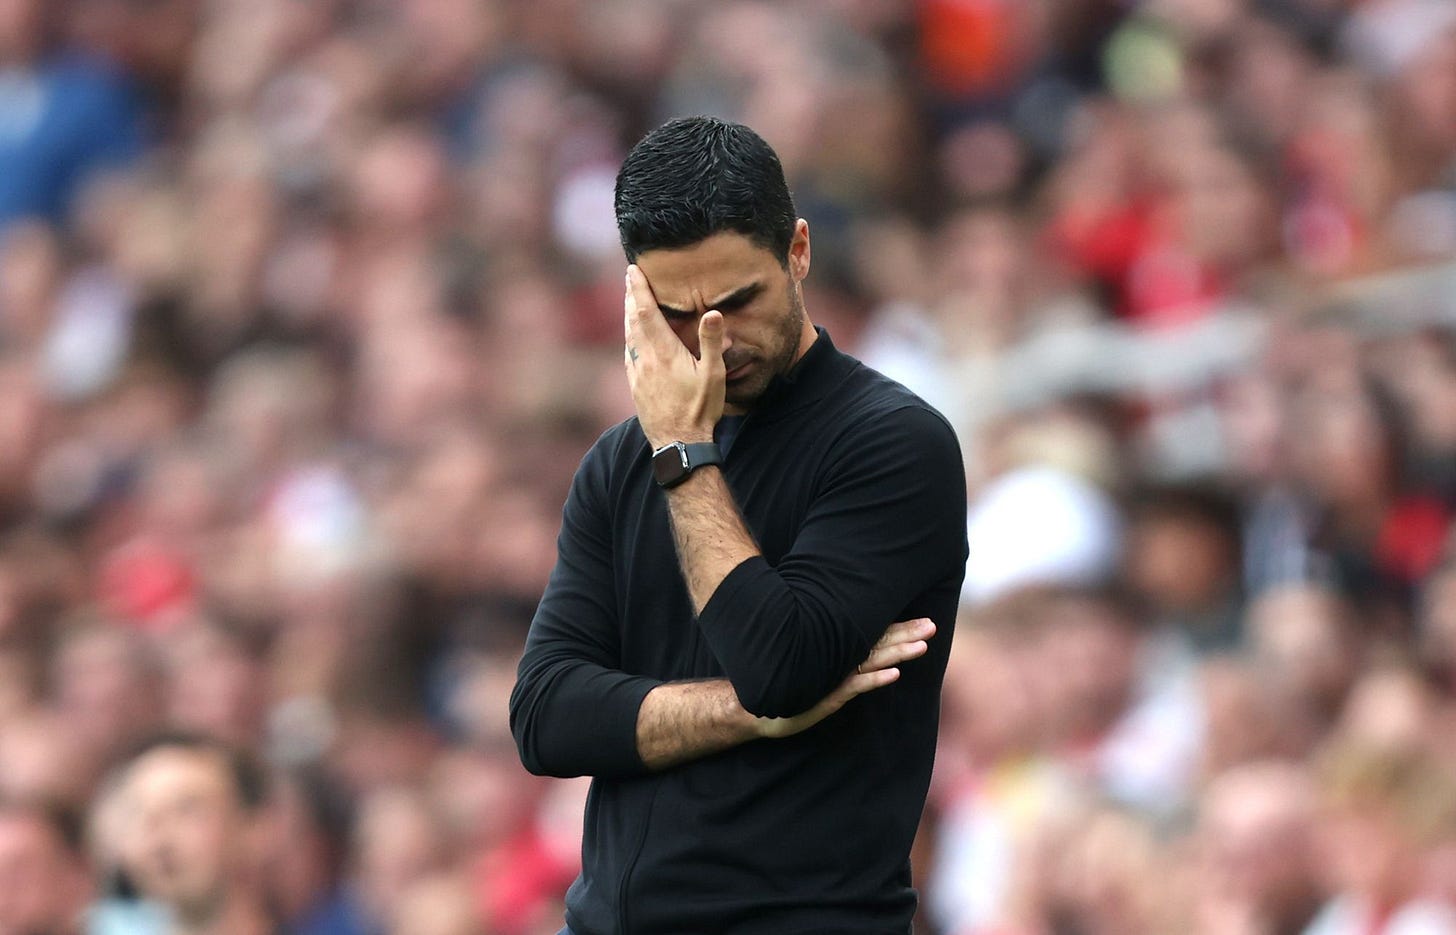
Even trying to do mitigation, this looks ugly. Arsenal has looked "off" in attack for a while and it is weird because the attacking talent is where I am most impressed with Arsenal. Arsenal has 4 matches against teams that are the same level or below them, so there is a good opportunity to try to find a groove for the attack because I think around the Liverpool match will really mark a decision point if Arsenal will stick with Arteta for the rest of the year.
Defense
The story on defense is roughly the same, instead of what the average team creates against them, it is what they are able to create against Arsenal compared to what they have created on average against other teams.
The headline number is that teams have created 124% of their average xG against Arsenal so far this season. Here is the match-by-match breakdown.
Brentford - AVG xG 1.39, against Arsenal they created 1.3, rating 94% (their third best-attacking numbers of the season)
Chelsea - AVG xG 1.66, against Arsenal they created 2.9, rating 175% (their best-attacking numbers of the season)
Manchester City - AVG xG 2.14, against Arsenal they created 3.8, rating 177% (their best-attacking numbers of the season)
Norwich City - AVG xG 0.81, against Arsenal they created 0.6, rating 74% (their fourth best-attacking numbers of the season)
Burnley - AVG xG 1.06, against Arsenal they created 1.3, rating 123% (their third best-attacking numbers of the season)
Tottenham - AVG xG 1.04, against Arsenal they created 1.0, rating 96% (their fourth best-attacking numbers of the season)
Brighton - AVG xG 1.06, against Arsenal they created 1.4, rating 132% (their second best-attacking numbers of the season)
Teams have had very good attacking days against Arsenal, with only the inept Norwich have a "bad" day against Arsenal compared to what they have done in other matches. These stats have the same caveats and context that needs to be put around them as the attacking numbers but it is again a huge worry that teams are having a good day out against Arsenal on a regular basis.
Final thoughts
I don't have a solution beyond, "Arteta should have them play better."
I don't even really have a lot of analysis beyond I was looking at things today as I ran my latest Premier League simulation and noticed this as I looked at why Arsenal continued to tumble down the team ratings.
I think the schedule ahead gives Arsenal a chance to find some momentum but I also thought that about the matches against Norwich and Burnley and while they helped it wasn't a panecea.
One to keep a watch on.

