
Find a Player's Statistical Twin
Explaining and introducing the Cannon Stats Similar Player Tool

Every scout, manager and football fan plays the same game eventually: who does this player remind me of? It's a great way to quickly make sense of the unfamiliar, saying an up and coming creative attacking midfielder is similar to Kevin De Bruyne gives you quick sense about them compared to a bunch of green bars or a radar.
The new Similar Player Search in Cannon Stats turns that instinct into something you can actually query: pick a player, and get a ranked list of the players whose statistical profile looks most like theirs.
It sounds simple and you will have seen other ways to go about trying to accomplish this same goal. Underneath the clean list of names sit two genuinely hard questions that I spent a long time trying to get right, and that are worth pulling apart because they shape every result you'll ever see: how do you measure "similar," and which stats, plus how many, do you use to decide? This post walks through both decisions going over the methods and their differences, and the metrics I chose and why.
The core idea: comparing players on the same ruler
You can’t compare a striker’s 0.6 non‑penalty xG per 90 to a center back’s 6.1 clearance and expect to learn anything from the raw numbers; they’re measuring different action with different units on different scales.
So the first thing this model does is standardize everything so that it is all on the same scale. For each stat, we look at the whole population of players in that role and express each player’s stat as a z‑score. A z-score is just a fancy way of saying how many standard deviations above or below the average they are. A z‑score of +2 in shot volume would mean “elite,” a ‑1 means “below average,” and now every stat speaks the same language and gives the same meaning for the number used.
Doing this for all of the stats turns each player into a vector, basically their stats become a string of ~16-18 numbers describing where they sit on every meaningful trait for their position/role.
This turns “Similar” into a geometry problem and the goal is to figure out which other players’ vectors point in the same direction, have the same volume, or sit closest in that space. The different methods are just different definitions of “closest.”
The methods: four ways to define "closest"
Ultimately I landed on giving four different ranking methods, and they help answer subtly different questions about how similar a player is to another.
Cosine compares the shape of two players’ profiles, not the size. This is the default method and after testing it out, it seems to be the nice happy medium position for answering the “which player is similar?” question. It measures the angle between the two vectors and ignores their length.
In football terms: a high‑volume, do‑everything winger and a lower‑volume player with the exact same balance of strengths will register as very similar, because they’re “the same kind of player” even if one simply does more of everything. When we ran it on Alexis Sánchez’s 2015‑16 season, cosine returned Arjen Robben, Neymar, Nolito, Lorenzo Insigne, Franck Ribéry, Lionel Messi, Mohamed Salah and Raheem Sterling, exactly the cohort of elite, high‑impact attacking wingers that would make sense if you’re familiar with Alexis.
PCA Cosine is cosine’s more sophisticated cousin. Before measuring the angle, it runs the profiles through Principal Component Analysis, which compresses the stat set down to a handful of independent “directions of variation” and throws away the noise. The effect is a de-noised ranking, it stops highly correlated metrics from getting double counted. On Sánchez it returned a near‑identical but slightly cleaner list (Neymar, Robben, Mario Götze, Érik Lamela, Salah, Ribéry, Gareth Bale), swapping a couple of borderline names for better ones. As we will go over in a bit, talking about the stats chosen, the list for each role has already been curated to avoid the kitchen sink method and the cleanup is mild but it could be useful in certain situations.
Euclidean distance is the most intuitive and the least forgiving method. It measures the absolute straight‑line distance between the two points in that space, which means it cares about magnitude as well as shape. Two players have to be similar in both what they do and how much, this is the tool if you want to find players at a genuinely comparable level and volume, not just a comparable style. It’s useful when you want “same player, same tier,” but it’s more sensitive to one stat being far off, and it degrades faster as you add more metrics (more on that below).
Category profile zooms out from individual stats to the seven Cannon Stats skill categories: shooting, creating, passing, carrying, receiving, defending, aerial. Instead of matching on the individual stats it matches on the shape across those seven buckets: a player who is 90th‑percentile shooting / 40th‑percentile passing / 20th‑percentile defending will be matched to others with that same shape. It’s a higher‑level, more forgiving view — good for “who has the same broad strengths and weaknesses,” less precise about the details.
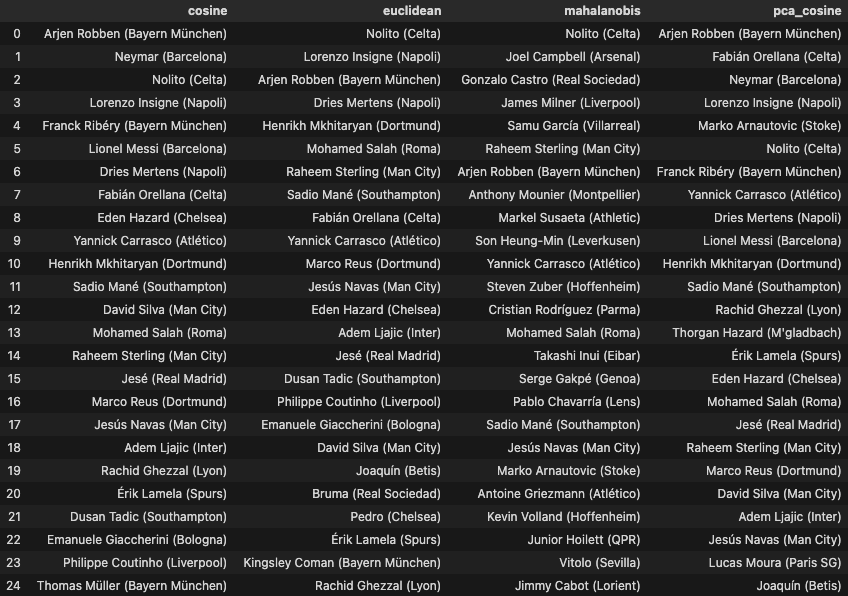
We also built and tested Mahalanobis distance, which is the theoretically “correct” way to handle the fact that football stats are heavily correlated. On paper it should be the best of the methods but in practice, on our data, it ended up just being a bit too noisy. For Sánchez it surfaced James Milner, Gonzalo Castro and Markel Susaeta, workmanlike players who could share similarity if you squint but weren’t really what we were after.
The harder question: which stats get a vote?
In my database, I have well over 300 different stats that I could use to try and build out a similarity model and that makes getting this part especially hard. My initial attempts at this threw in a ton of stats following the intuition that more stats is more better.
After running some tests, and a lot of weird results with similar players coming back looking very funky, I learned that the opposite is true and that there is an optimal level.
Two problems sink the "throw everything in" approach. The first is the curse of dimensionality: as you pile on metrics, the distances between players flatten out — everyone drifts toward being "moderately similar to everyone," and the top of your list gets noisy and unstable.
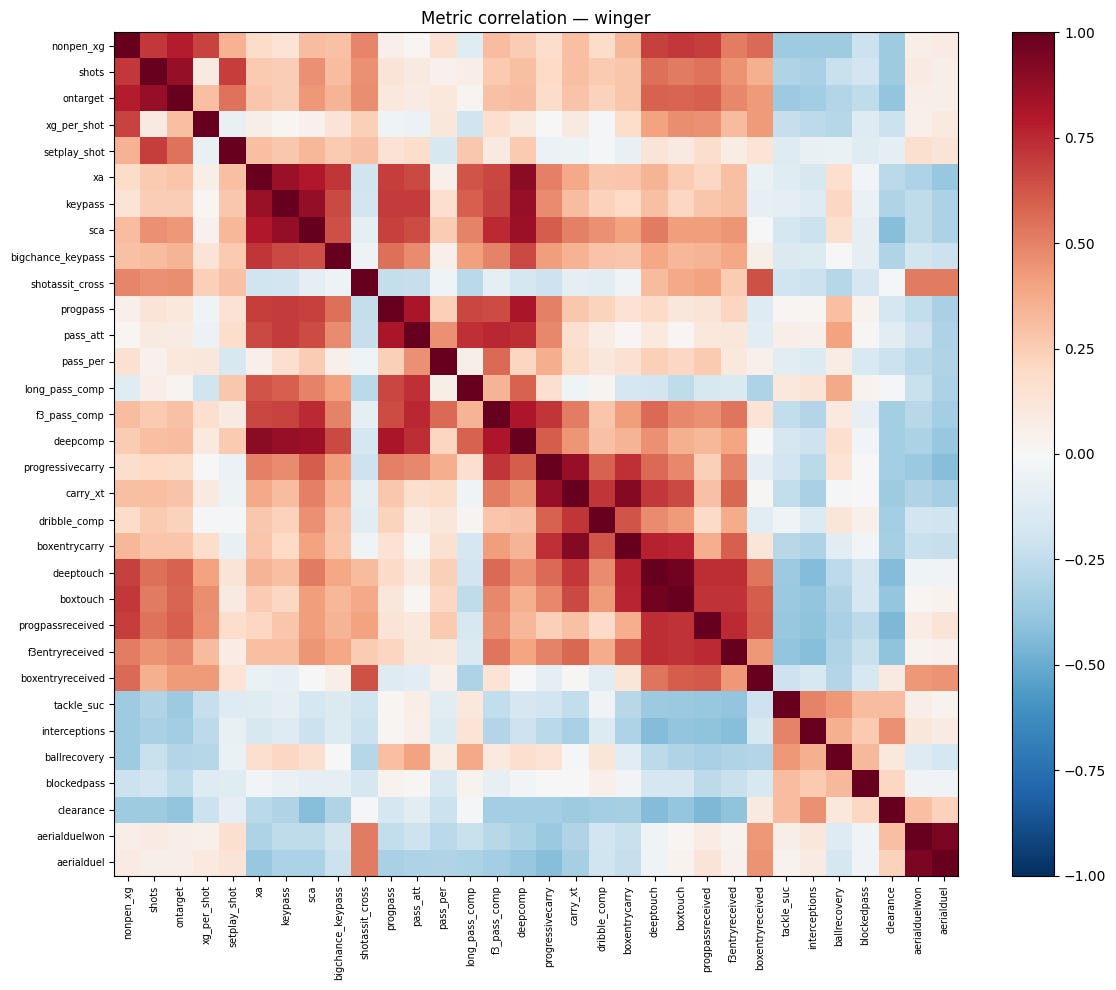
The second, and bigger, is multicollinearity: football stats are massively correlated with each other. When I measured it for wingers, deep touches and box touches correlated at 0.97, aerial duels won and aerial duels attempted at 0.94, carry threat (xT) and box‑entry carries at 0.91, expected assists and deep completions at 0.90. When you start feeding this into the model, you haven't added information, instead all you've done is told it that "being involved in attacking areas" matters four or five times as much as everything else, just because four or five stats all measure roughly the same thing in a slightly different way.
I started with a list of roughly 50 stats that I had narrowed down from the initial 300 and picked out the key ones from different families to try still capture the skill but to keep things balanced. In the end I was able to create role specific lists of around 18 stats, with no pairs of stats at more than a 0.8 correlation.
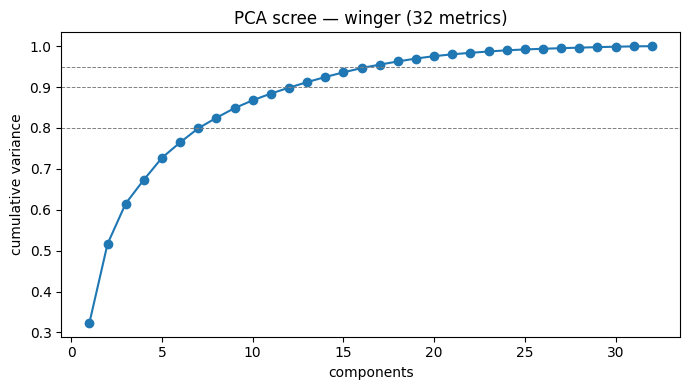
How did we know roughly 16 was the right number and not 10 or 40? Two checks. First, we ran PCA on the full set and looked at how many independent dimensions actually exist in winger play: 8 components explained 80% of the variation, 13 explained 90%, at 17 we hit 95%. In other words there are really only ~10–15 distinct "things" a winger can be good or bad at, beyond that and there is a lot of repetition.
Second, we ran a stability test: take the target player's top‑10 most‑similar list using 10, 20 and all metrics and measure how much it changes. Going from 10 to 20 metrics shifted about a third of the names, suggesting that at 10 we are under‑specified. But going from 20 to the full set barely moved it (82% overlap), so we didn’t get much change for the added under of metrics.
This pointed to a nice target around 15 metrics and that is where I landed. The lists are also position/role specific. The metrics for a striker are purposefully different than a center back. I have made it so that you could look at a player on different profiles and see how that changes the players come back as similar.
Using it
For this I have made this as flexible as possible:
you can set the position/role
you can set the season(s) and competition(s) for the player you want to find the similar player to
you can set the season(s) for where you want to search against
you can limit by age for who you want to compare against
you can limit by position for the players to compare against
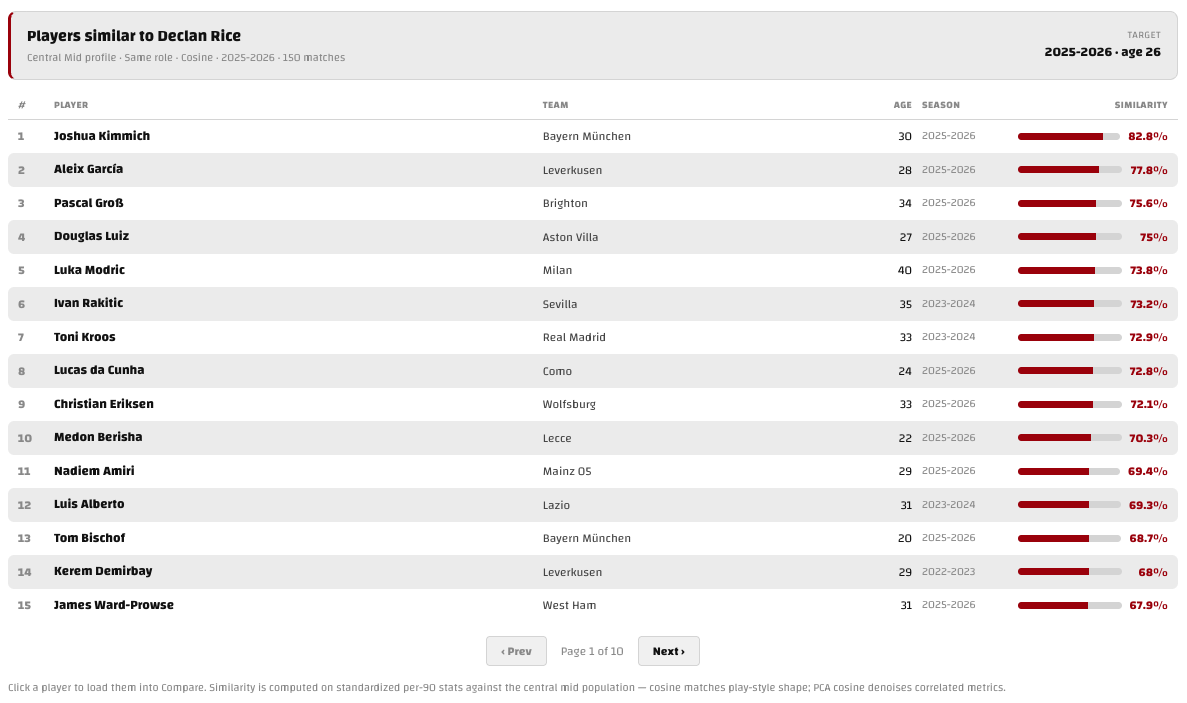
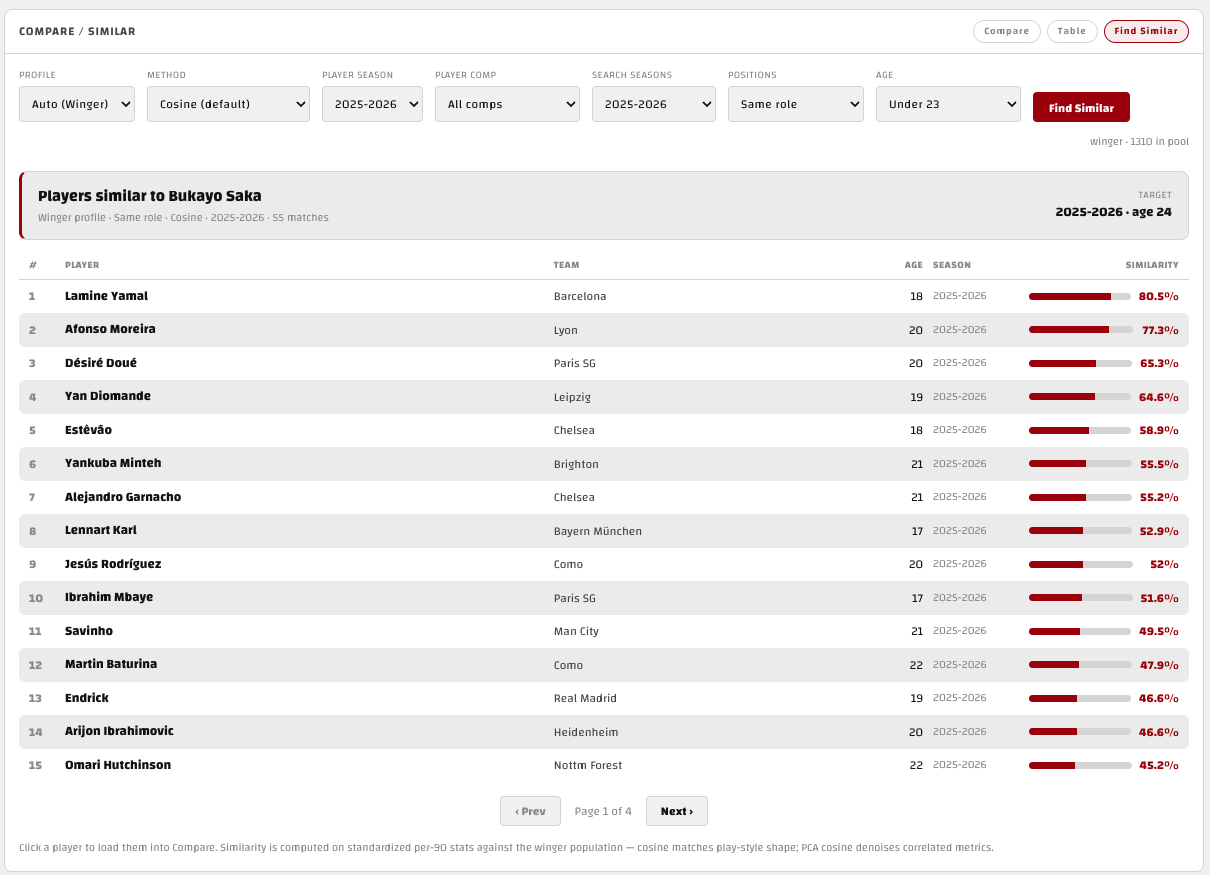
For example, here are the U23 players most similar to Bukayo Saka last season on the winger profile.
No similarity model is the truth. It’s a lens, and it inherits the limits of its inputs.
A model only knows what’s in the stat set, so it can’t (and will never) see things those stats don’t capture (a player’s temperament, their fit in a specific system, the quality of their league, etc).
But used the way it’s meant to be this should be a fun and useful too. Who doesn’t want a fast, rigorous starting point for answering the question “who plays like this, and where do I find more of them?” I am looking forward to playing around with it more and once the web app has passed a bit more validation hopefully you all will as well.
How am I supposed to do my AVP DoF without this now that I know it exists? In all honesty, this is going to be awesome.
Not sure how to actually access the tool myself. Any tips?
Additionally, would be great to be able to zoom in on the pics on mobile!