Forward Rating System
This is will be a shorter post than the midfield one because it is basically a copy of that but I wanted to have a page that I could still point to for an explanation. Below is a link to that, which goes more into the back story of the rating system.
Stats Used
For this forward rating system, I have broken up the midfield skills into six skills/attribute types. They are shooting, receiving, passing, carrying, ball-winning, and creating.
Each stat used is given a z-score to illustrate how far a player is from the mean by standard deviations. This is helpful because it will give players that are very good or very bad more and less credit than simply doing percentiles.
The stats in the shooting category are open play shots, non-penalty expected goals (xG), Non-Penalty Goals, xG Per Shot, percentage of shots on target, and shots per touch within 25 yards of goal.
The stats in the creating category are assists, shot-creating actions, open play key passes, open play expected assists, assists, and deep completions (not from a cross).
The stats in the passing category are progressive passing, pass efficiency (actual passing rate compared to expected passing rate), passes completed, forward pass %, total progressive passing distance, and Goal Probability added passing.
The stats in the carrying category are progressive carries, turnover efficiency (how often a player loses the ball compared to expected based on where they touch the ball and how many dribbles they attempt), total progressive distance carried, dribbles completed, dribble success rate, and progressive passes received.
The stats in the ball-winning (I am using this term over defense here because I think that is a more accurate description of what we are measuring) category are pressures, pressure regains, successful tackles, interceptions, blocked passes, ball recoveries, and fouls committed (where things are reversed so fewer fouls is better).
The stats in the receiving/link up category are aerials won, aerial duel win%, Goal Probability received, xG Chain Usage (percentage of team's total xG that a player is a part of while they are on the field), offsides, progressive passes received, and final third entry passes received.
You may have different thoughts on the stats that go into this and I would love to hear your thoughts (oh.that.crab at gmail dot com to reach me) but I think that these stats paint a good picture and with weighting, these can be adjusted up and down based on the role that we want to try to measure.
Weighting
This section was the one that I struggled with the most. I think it is pretty obvious that certain actions are more important/more valuable than others and should count for more. The question is how much more?
To go through this I have decided that the best way to do this is with a flexible weighting system that I can adjust based on the role template. I have started with two roles for the forward/striker, "Complete Forward" and "Poacher".
I will add additional roles as time allows and update the weighting used here as those come available.
Complete Forward Weights
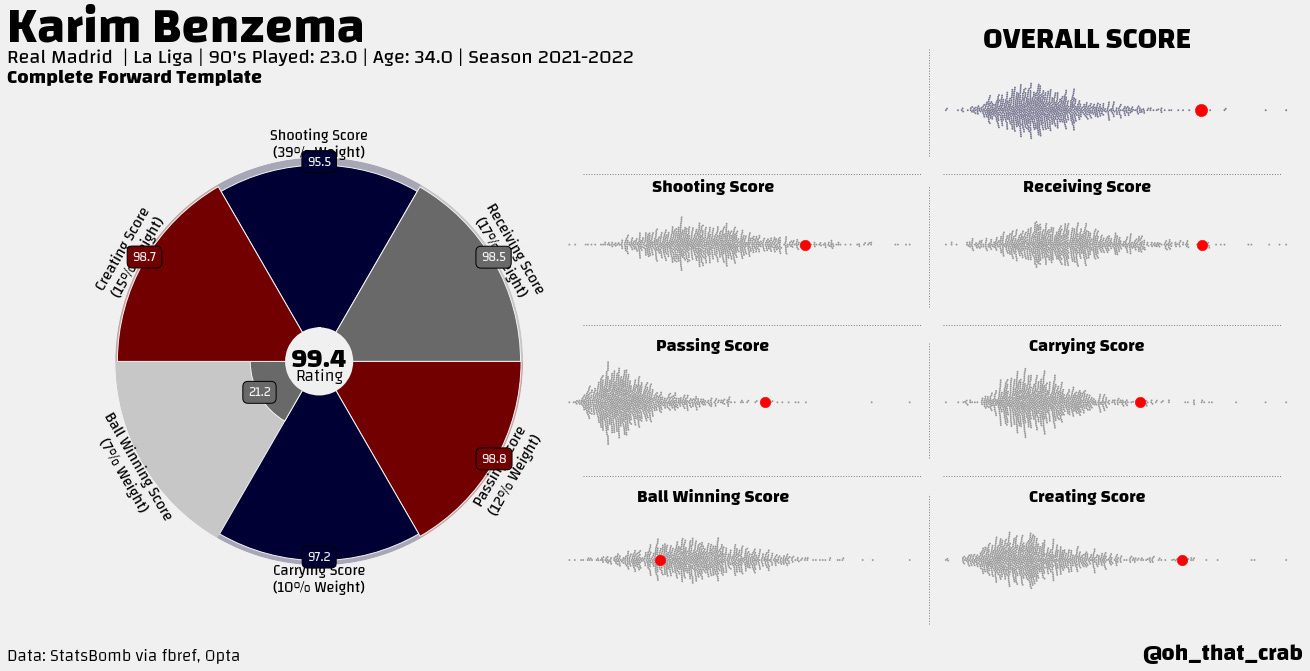
Shooting: open play shots (18%), NPxG (24%), NPGoals (18%), xG Per Shot (18%), percentage of shots on target (13%), and shots per touch within 25 yards of goal (9%). Overall weight 39%.
Receiving/Linkup: aerials won, aerial duel win% (10%), Goal Probability received (10%), xG Chain Usage (30%), offsides (25%), progressive passes received (17%), and final third entry passes received (5%). Overall weight 17%.
Creating: assists (7%), shot-creating actions (30%), open play key passes (13%), open play expected assists (30%), and deep completions (20%). Overall weight 15%.
Passing: progressive passing (25%), pass efficiency (25%), final third entries (15%), forward pass % (10%), total progressive passing distance (10%), and Goal Probability added passing (15%). Overall weight 12%.
Carrying: progressive carries (20%), turnover efficiency (21%), total progressive distance carried (20%), dribbles completed (15%), dribble success rate (19%), and progressive passes received (5%). Overall weight 10%.
Ball Winning: pressures (10%), pressure regains (20%), successful tackles (20%), interceptions (15%), blocked passes (15%), ball recoveries (10%), and fouls committed (10%). Overall weight 7%.
Poacher Forward Weights
Shooting: open play shots (18%), NPxG (24%), NPGoals (18%), xG Per Shot (18%), percentage of shots on target (13%), and shots per touch within 25 yards of goal (9%). Overall weight 49%.
Receiving/Linkup: aerials won, aerial duel win% (10%), Goal Probability received (10%), xG Chain Usage (30%), offsides (25%), progressive passes received (17%), and final third entry passes received (5%). Overall weight 17%.
Creating: assists (7%), shot-creating actions (30%), open play key passes (13%), open play expected assists (30%), and deep completions (20%). Overall weight 10%.
Passing: progressive passing (25%), pass efficiency (25%), final third entries (15%), forward pass % (10%), total progressive passing distance (10%), and Goal Probability added passing (15%). Overall weight 8%.
Carrying: progressive carries (20%), turnover efficiency (21%), total progressive distance carried (20%), dribbles completed (15%), dribble success rate (19%), and progressive passes received (5%). Overall weight 7%.
Ball Winning: pressures (10%), pressure regains (20%), successful tackles (20%), interceptions (15%), blocked passes (15%), ball recoveries (10%), and fouls committed (10%). Overall weight 7%.
These stats then feed into an overall rating that is also calculated using z-scores but with an overall rating that is represented as a percentile so that things look pretty on the 0-100 scale.
In the visualization used to represent this information, things are shown as both the percentile rank (left on the crab cake) and as to where they fall on the z-score distribution for the stat (right).
Limitations
No single number score is going to be perfect and I am fully aware that these are not that. I would be careful in using this, with the thought that this helps to create shortlists for further analysis and comparisons.
The position filters are not always perfect for these so some players do not fit well into these. Players are asked to do different things and that will obviously change their statistical output. The quality of teams and the league that players play in will change things (on that front this only uses players from the "top 5 leagues") as well as the tactics that the teams use.
Another thing that I want to add (and I am working towards that) is a weight towards playing time. Right now the cut-off is 800 minutes, with 35% or more coming at forward and at least 85% coming in wide forward and striker. I would like to add in the percentage of minutes available played as actually getting on the field is quite valuable but that is not fully captured here.
There is also the actual weighting used here and how that can change things. People will certainly have different priorities and opinions on things. I have done my best here to show what I have done but other choices are certainly valid.


