
Historical transfer inflation


Comparing transfer fees for players between years happens all of the time. We look back at historical fees as a guidance for what players of similar caliber should cost now.
The only problem with doing this is that the inflation in transfer fees has been very different that the general inflation rate.
So to help as we prepare for going into the summer transfer window I spent some time and looked up Premier League transfer fees going back to the 1996-97 season (the start of the Wenger Era) to calculate the inflation rate.
There are a number of different ways that you can do this but for me I ultimately decided that I would use the change in the median transfer fee and exclude free transfers.
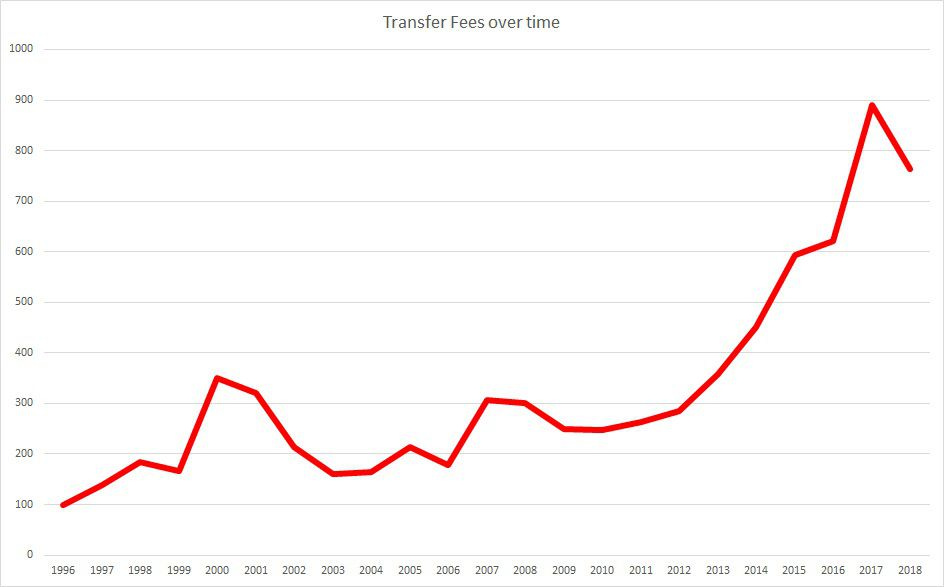
The above chart shows with the starting season of the 1996-97 season a transfer of 100 would be over time. In 2018-19 transfer pounds that 100 is the same as about 760.
One of the things that is really interesting is that the current inflation is massive compared to what was seen in previous years. From 1999 to 2006 prices were volatile but the overall changes were fairly stable before jumping to another relatively stable period between 2007 and 2012. Things explode after the summer 2013.
This very closely matches what happens with the TV revenue that Premier League Clubs has received:
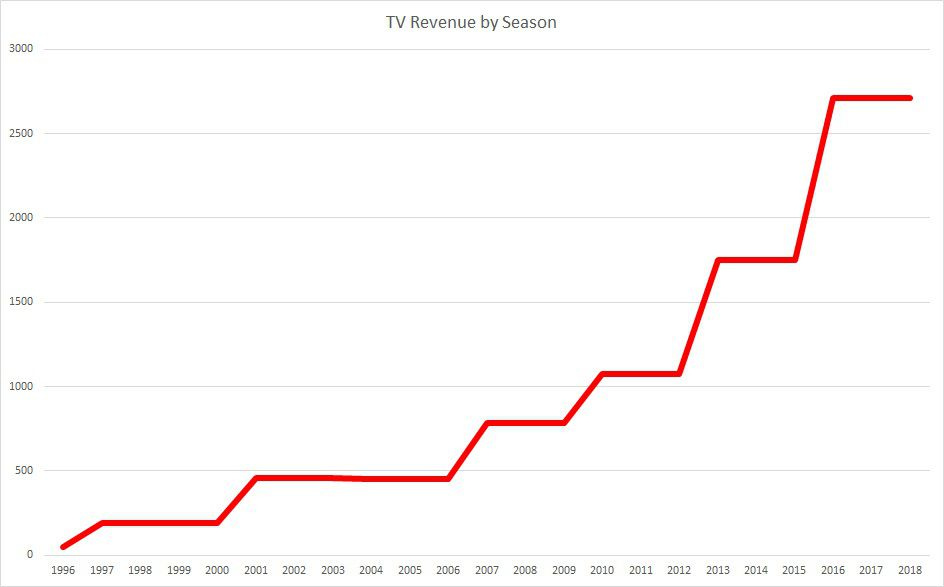
I haven’t found a solid source for what the next total TV revenue will be for the next three year rights window but it looks like around £9 billion total which will be a relatively small bump from the current £2.7 billion per year that is split. Using what has happened in the past that would make me believe that the general inflation will be modest over the next three years (but their is no accounting for massive outside money coming in that might effect things).
One of the other fun (I think its fun, YMMV) things is that by looking at all transfers I could break down transfer spending by different categories. First is by different percentile.
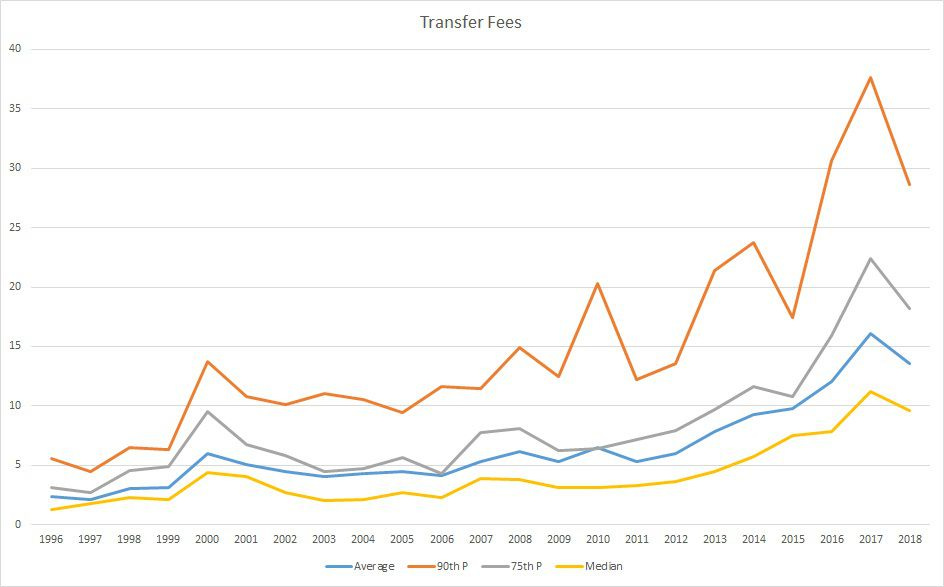
The top end has more variability, which isn’t that surprising while the average transfer fee pretty closely hangs around the 75th percentile fee with the gap expanding over the few seasons.
By age range:
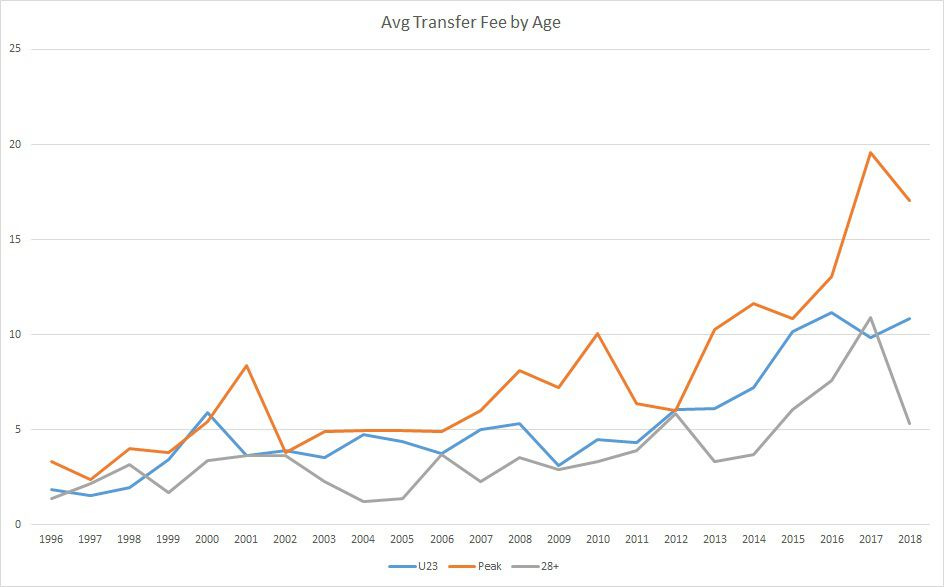
Transfer fees used to be a lot more bunched together regardless of age but since the mid to late 2000’s peak players have gotten more expensive and younger players following suit in the 2010’s.
Finally by position:
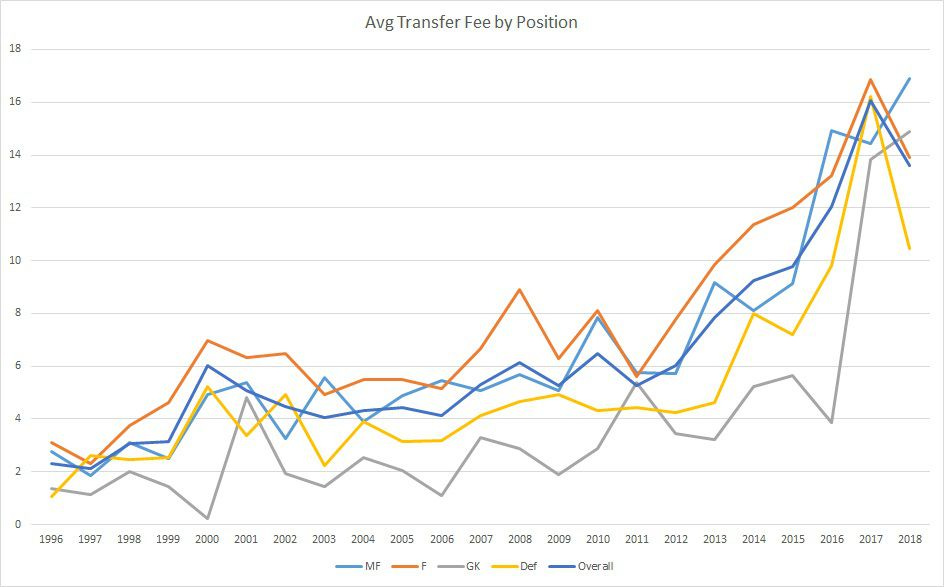
For the most part, midfielders and forwards were the most expensive players, with goalkeepers seeing the lowest average prices. All of that got messed up in the great buying binge of 2017-18. It will be interesting to see how the prices change by position over the next few seasons.
If you want to do the transfer inflation changes you can you use the following to calculate based on the year of the transfer.
Transfer Fee Change by Season

So to calculate you would look up a transfer fee, say Mesut Özil which was £42.30m in 2013-14 and then the change in price in the table above which is 101%. Then you would do 100 + change in price * transfer fee and you would get a figure of approximately £85m in today’s transfer prices.
Below are the top 25 most expensive fees adjusted for inflation.
Top 25 Transfer Fees Premier League (Inflation Adjusted)

Data to calculate this came from transfermarkt.co.uk which I am very grateful that they have this wealth of data even if figures for fees might vary from what you will find in other places.
This post originally ran on The Short Fuse