
Introducing the Cannon Stats Finishing Skill Model
Moving beyond the simple Goals - xG and hope for the best

Goals minus expected goals.
It’s the go-to stat when people want to talk about finishing quality. Player X scored 15 goals from 10 xG, so they must be a great finisher. Player Y scored 8 from 12 xG, so they’re clearly wasteful. Case closed.
Except it’s not.
G-xG is one of the noisiest stats in football. A player can over-perform xG by 5 goals one season and under-perform by 3 the next, with no change in actual ability. Small samples, random variance, and the binary nature of goals (you either score or you don’t) make raw single season G-xG deeply unreliable as a measure of finishing skill.
Just to illustrate this a bit more, here is how season to season the values correlate with each other for the Premier League 2017/18 through 2025/26.
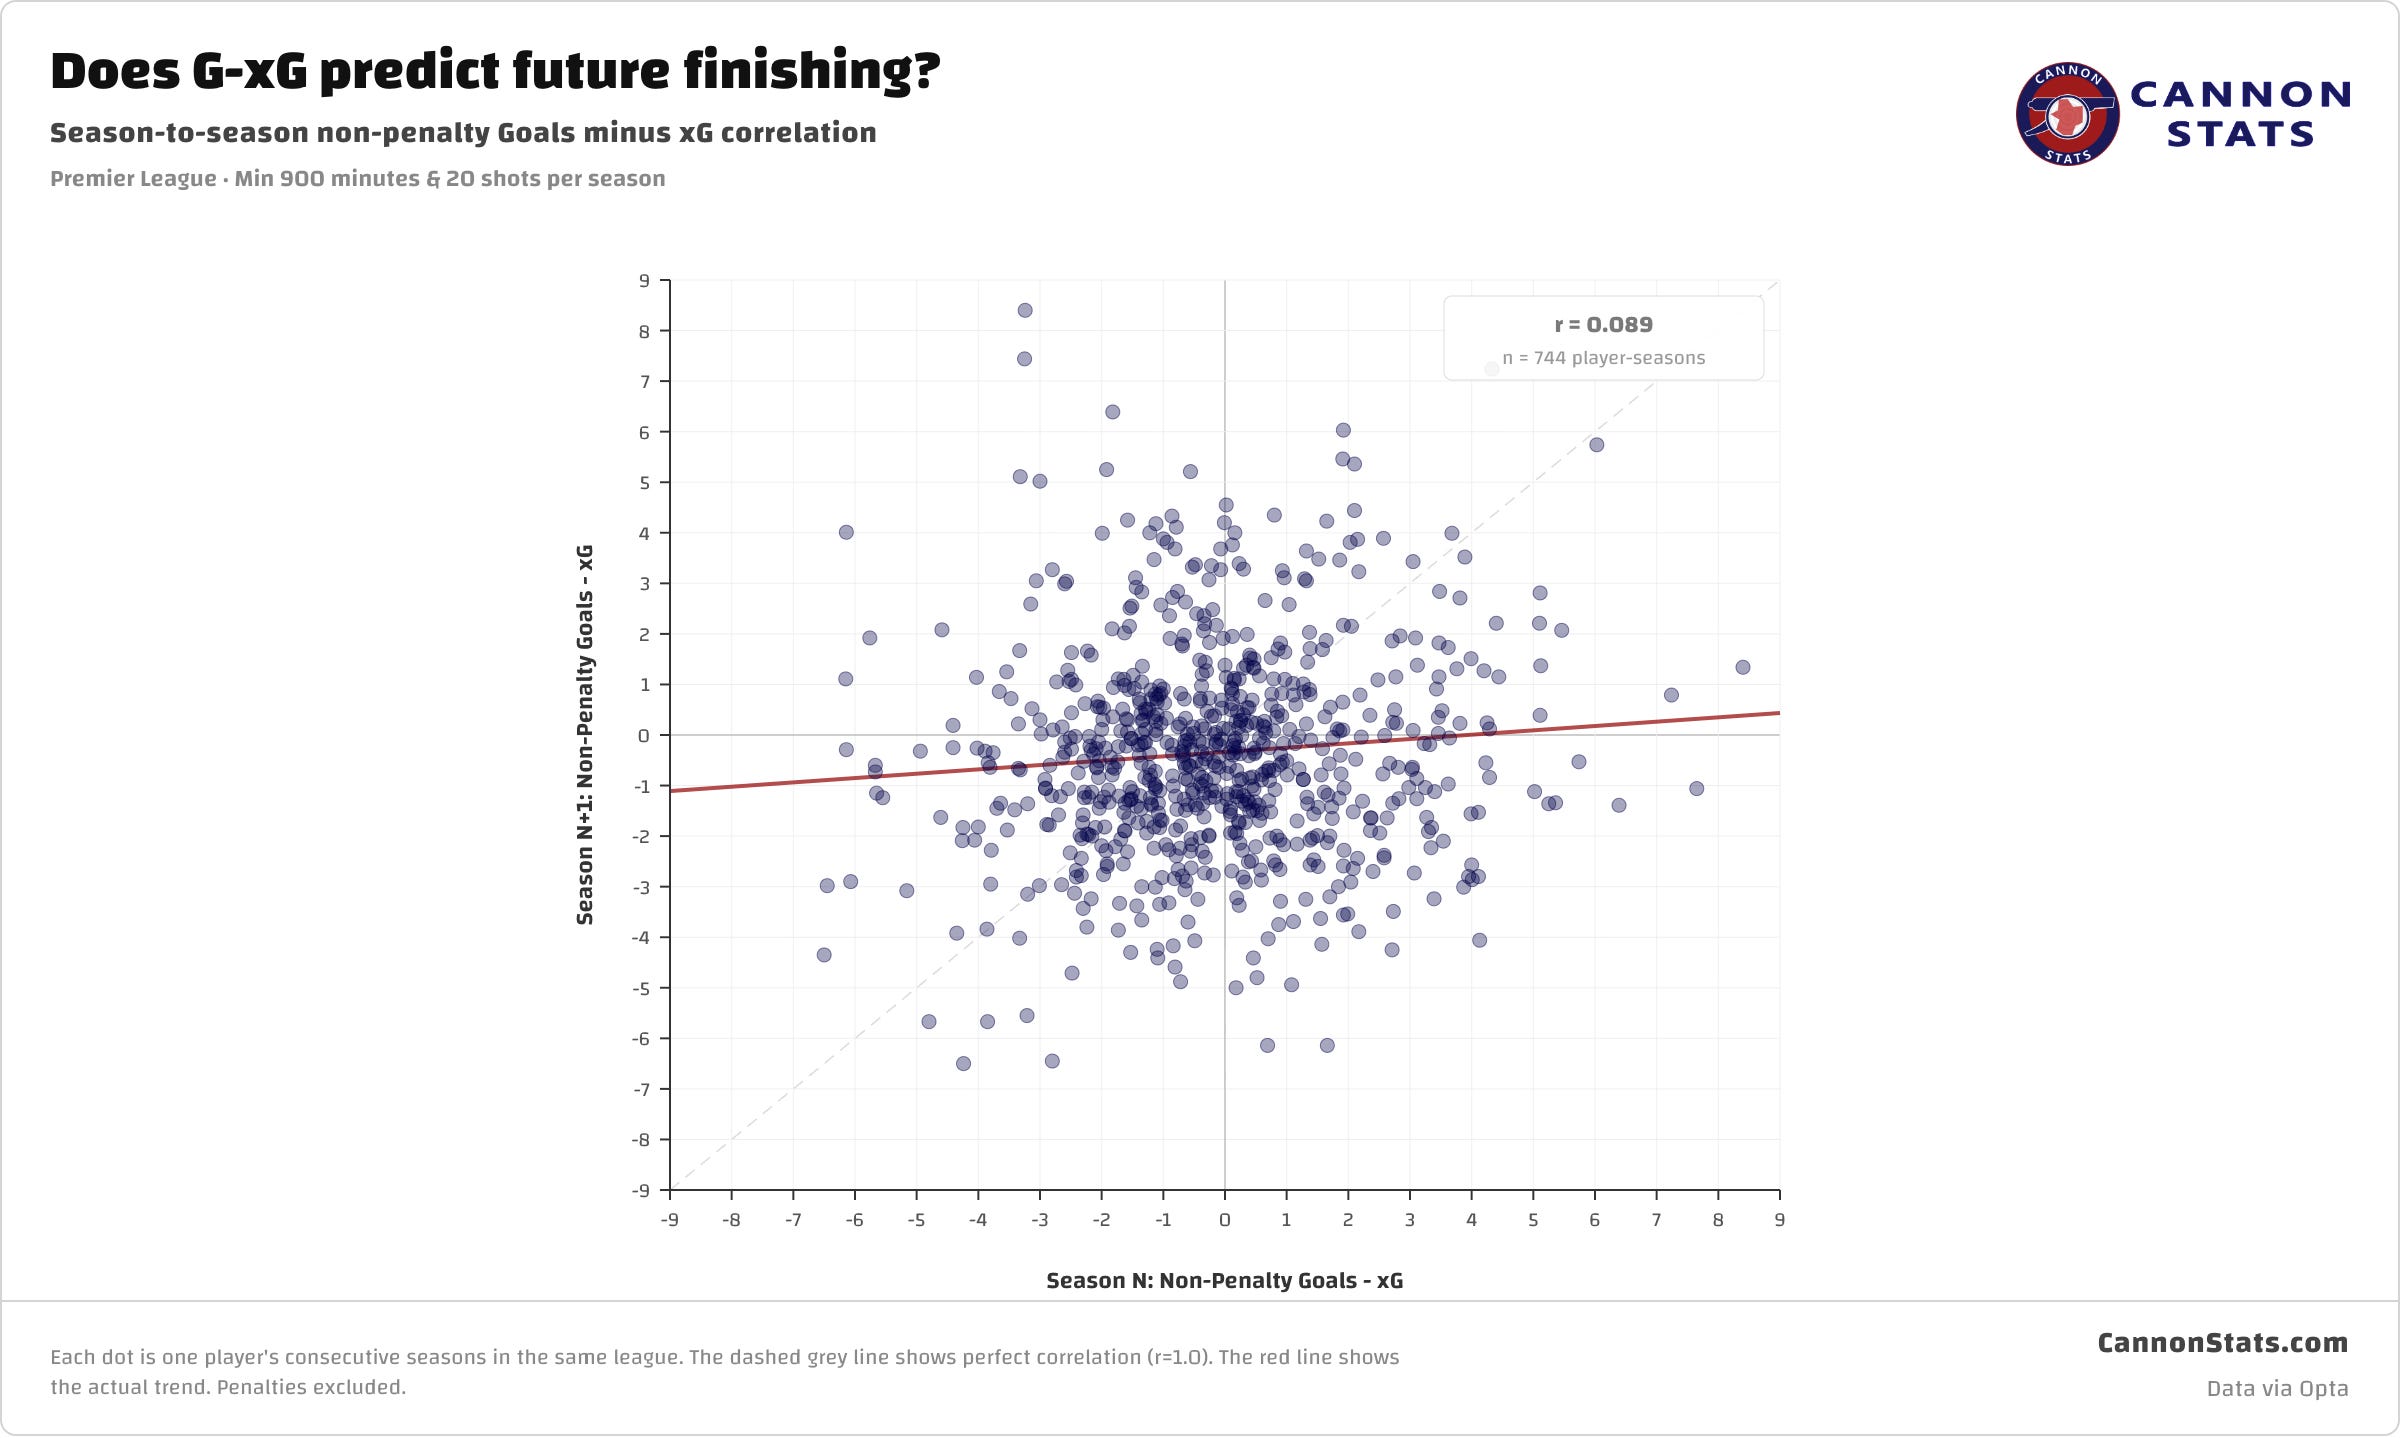
If this was a good measure we would expect to see the numbers be bunched around the 45 degree line that runs through the chart, instead the red regression line is nearly flat and shows that the season to season relationship is extremely weak.
Here is what the correlation looks like for all of the big five leagues.


The trend holds and at the high level, just using goal - expected goals to try and identify finishing skill is tough.
A smarter approach: Bayesian finishing skill
The Cannon Stats finishing model uses Bayesian hierarchical logistic regression to estimate each player’s true finishing ability. This approach was guided by previous work down by Martin Eastwood on his blog pena.lt/y and Marek Kwiatkowski with his work at Statsbomb.
Bayesian hierarchical logistic regression is a mouthful, so here’s what it actually means in plain terms.
The model starts from the assumption that a player is an average finisher and as evidence (shots/goals) starts coming in, the prior belief about the finishing skill is updated up or down.
The key difference from simple G-xG is that the model accounts for sample size and uses this to help us get an idea of how certain we should be about what has happened.
A player with 30 shots gets a wide range of uncertainty, because the model knows it doesn’t have enough evidence yet. The model learns about the overall population variance and uses that on the player level pulling players with smaller sample back towards average. A player with 4 goals from those 30 shots could be elite, but the model stays skeptical and keeps their estimated finishing skill around 0. It takes sustained over or under performance to move the estimates away from average.
The final output is a finishing skill value. Positive means the player converts chances at a higher rate than xG predicts. Negative means lower. Zero is perfectly average. Alongside the estimate, the model produces a 90% confidence interval: the range where the player’s true finishing ability most likely falls and helping give us a ballpark of just how confident we should be in that we are seeing true skill vs luck.
What it looks like in practice
Here is where the rubber meets the road. To do a sanity check here are the top 15 players on finishing skill.
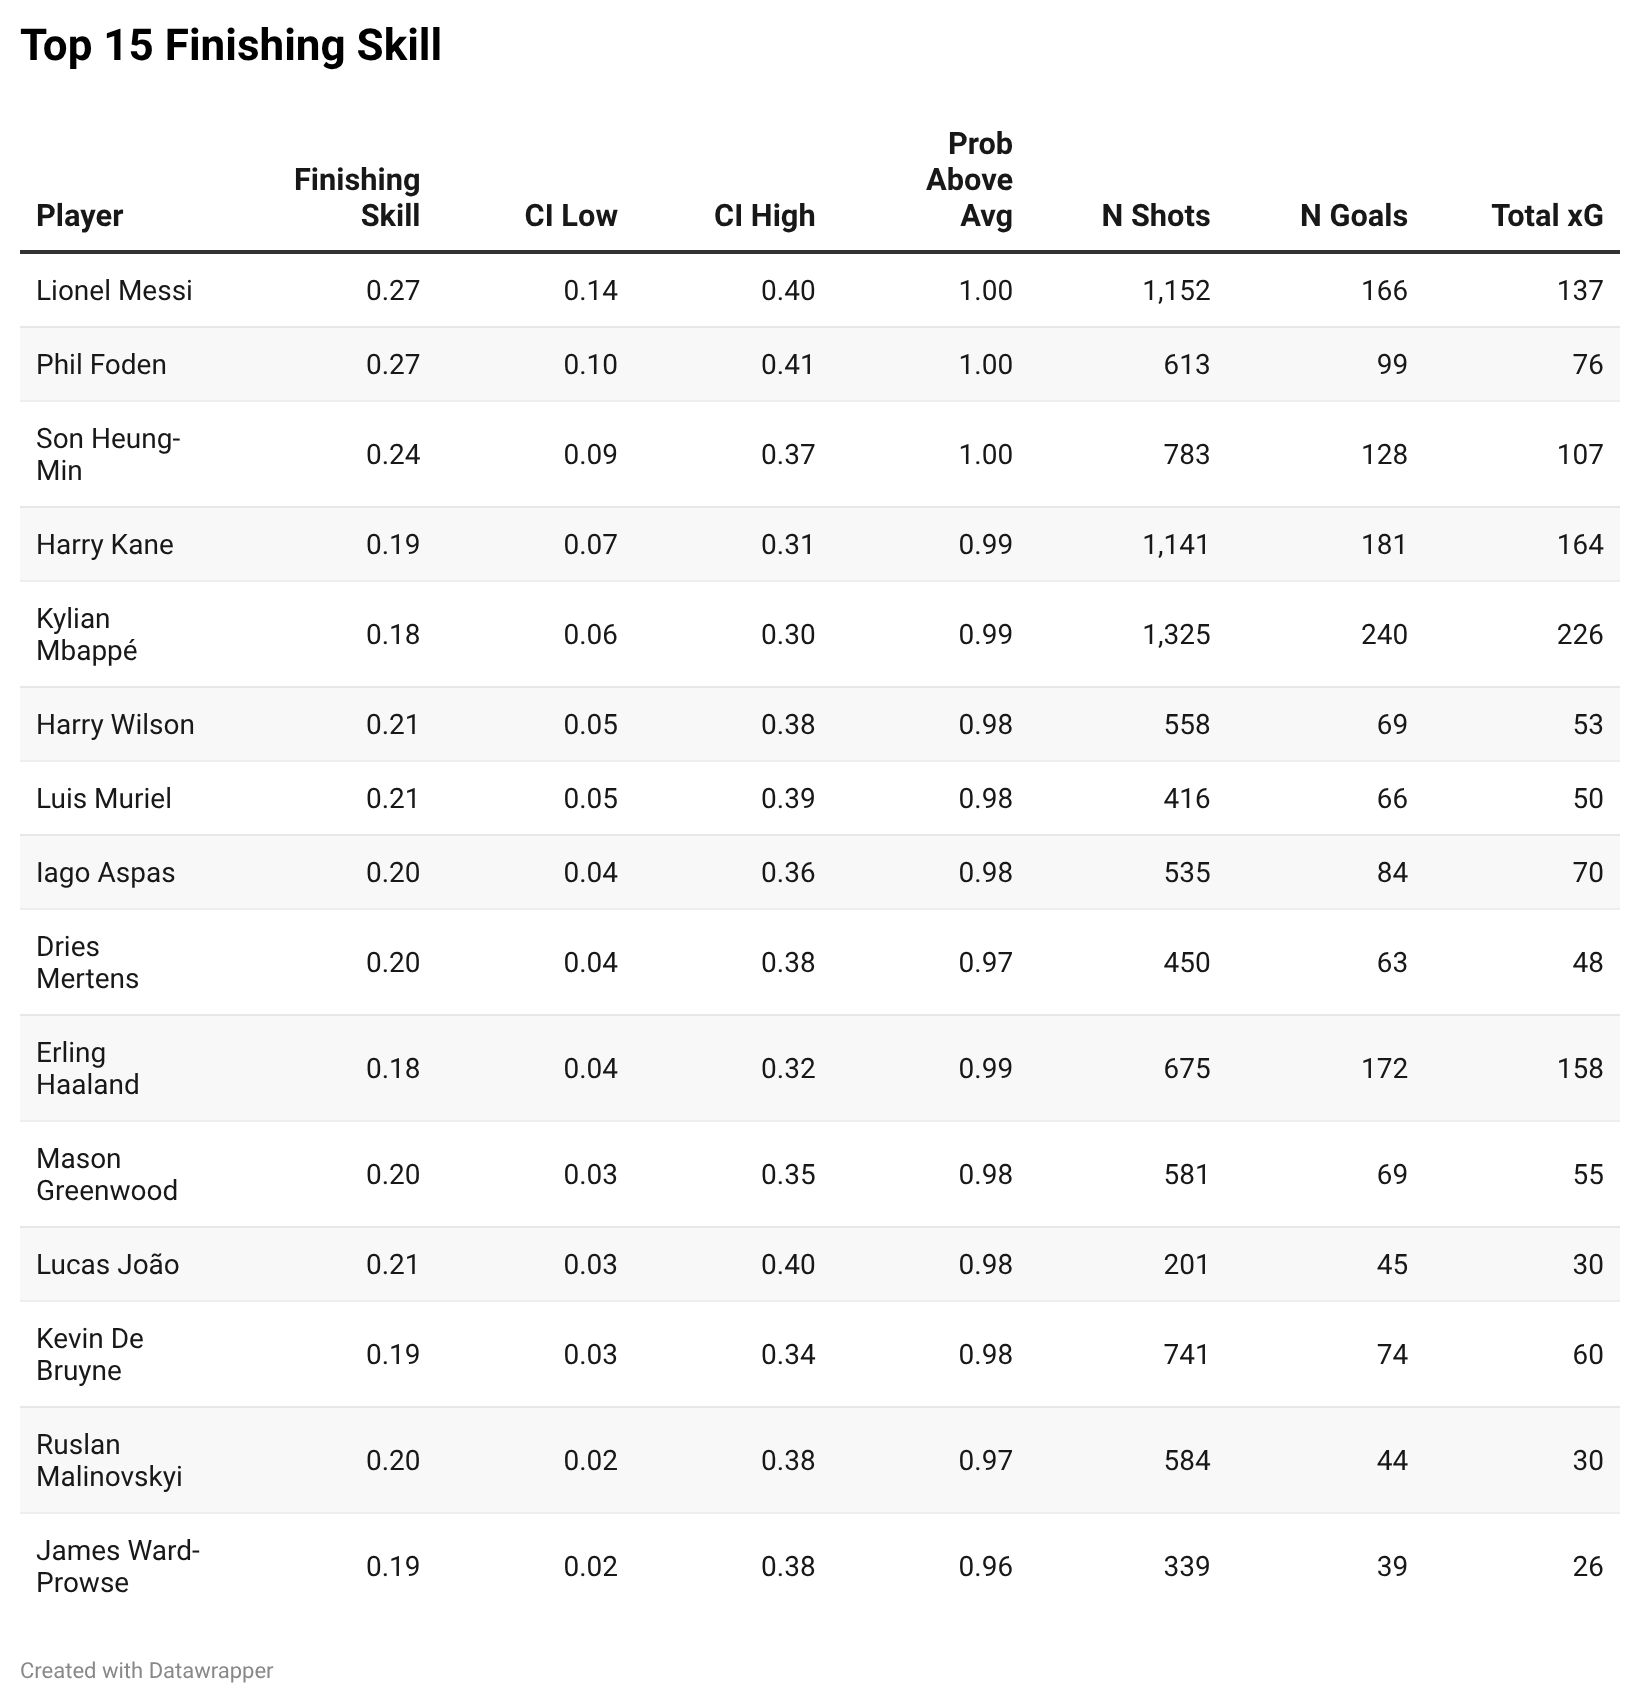
It is always reassuring when you see Lionel Messi top an attacking metric and this is no different. Overall the list is filled with players that I think would be thought of as good ball strikers and finishers.
I have taken an extra step to build out a bit of a dashboard as well to be able to present the data here.
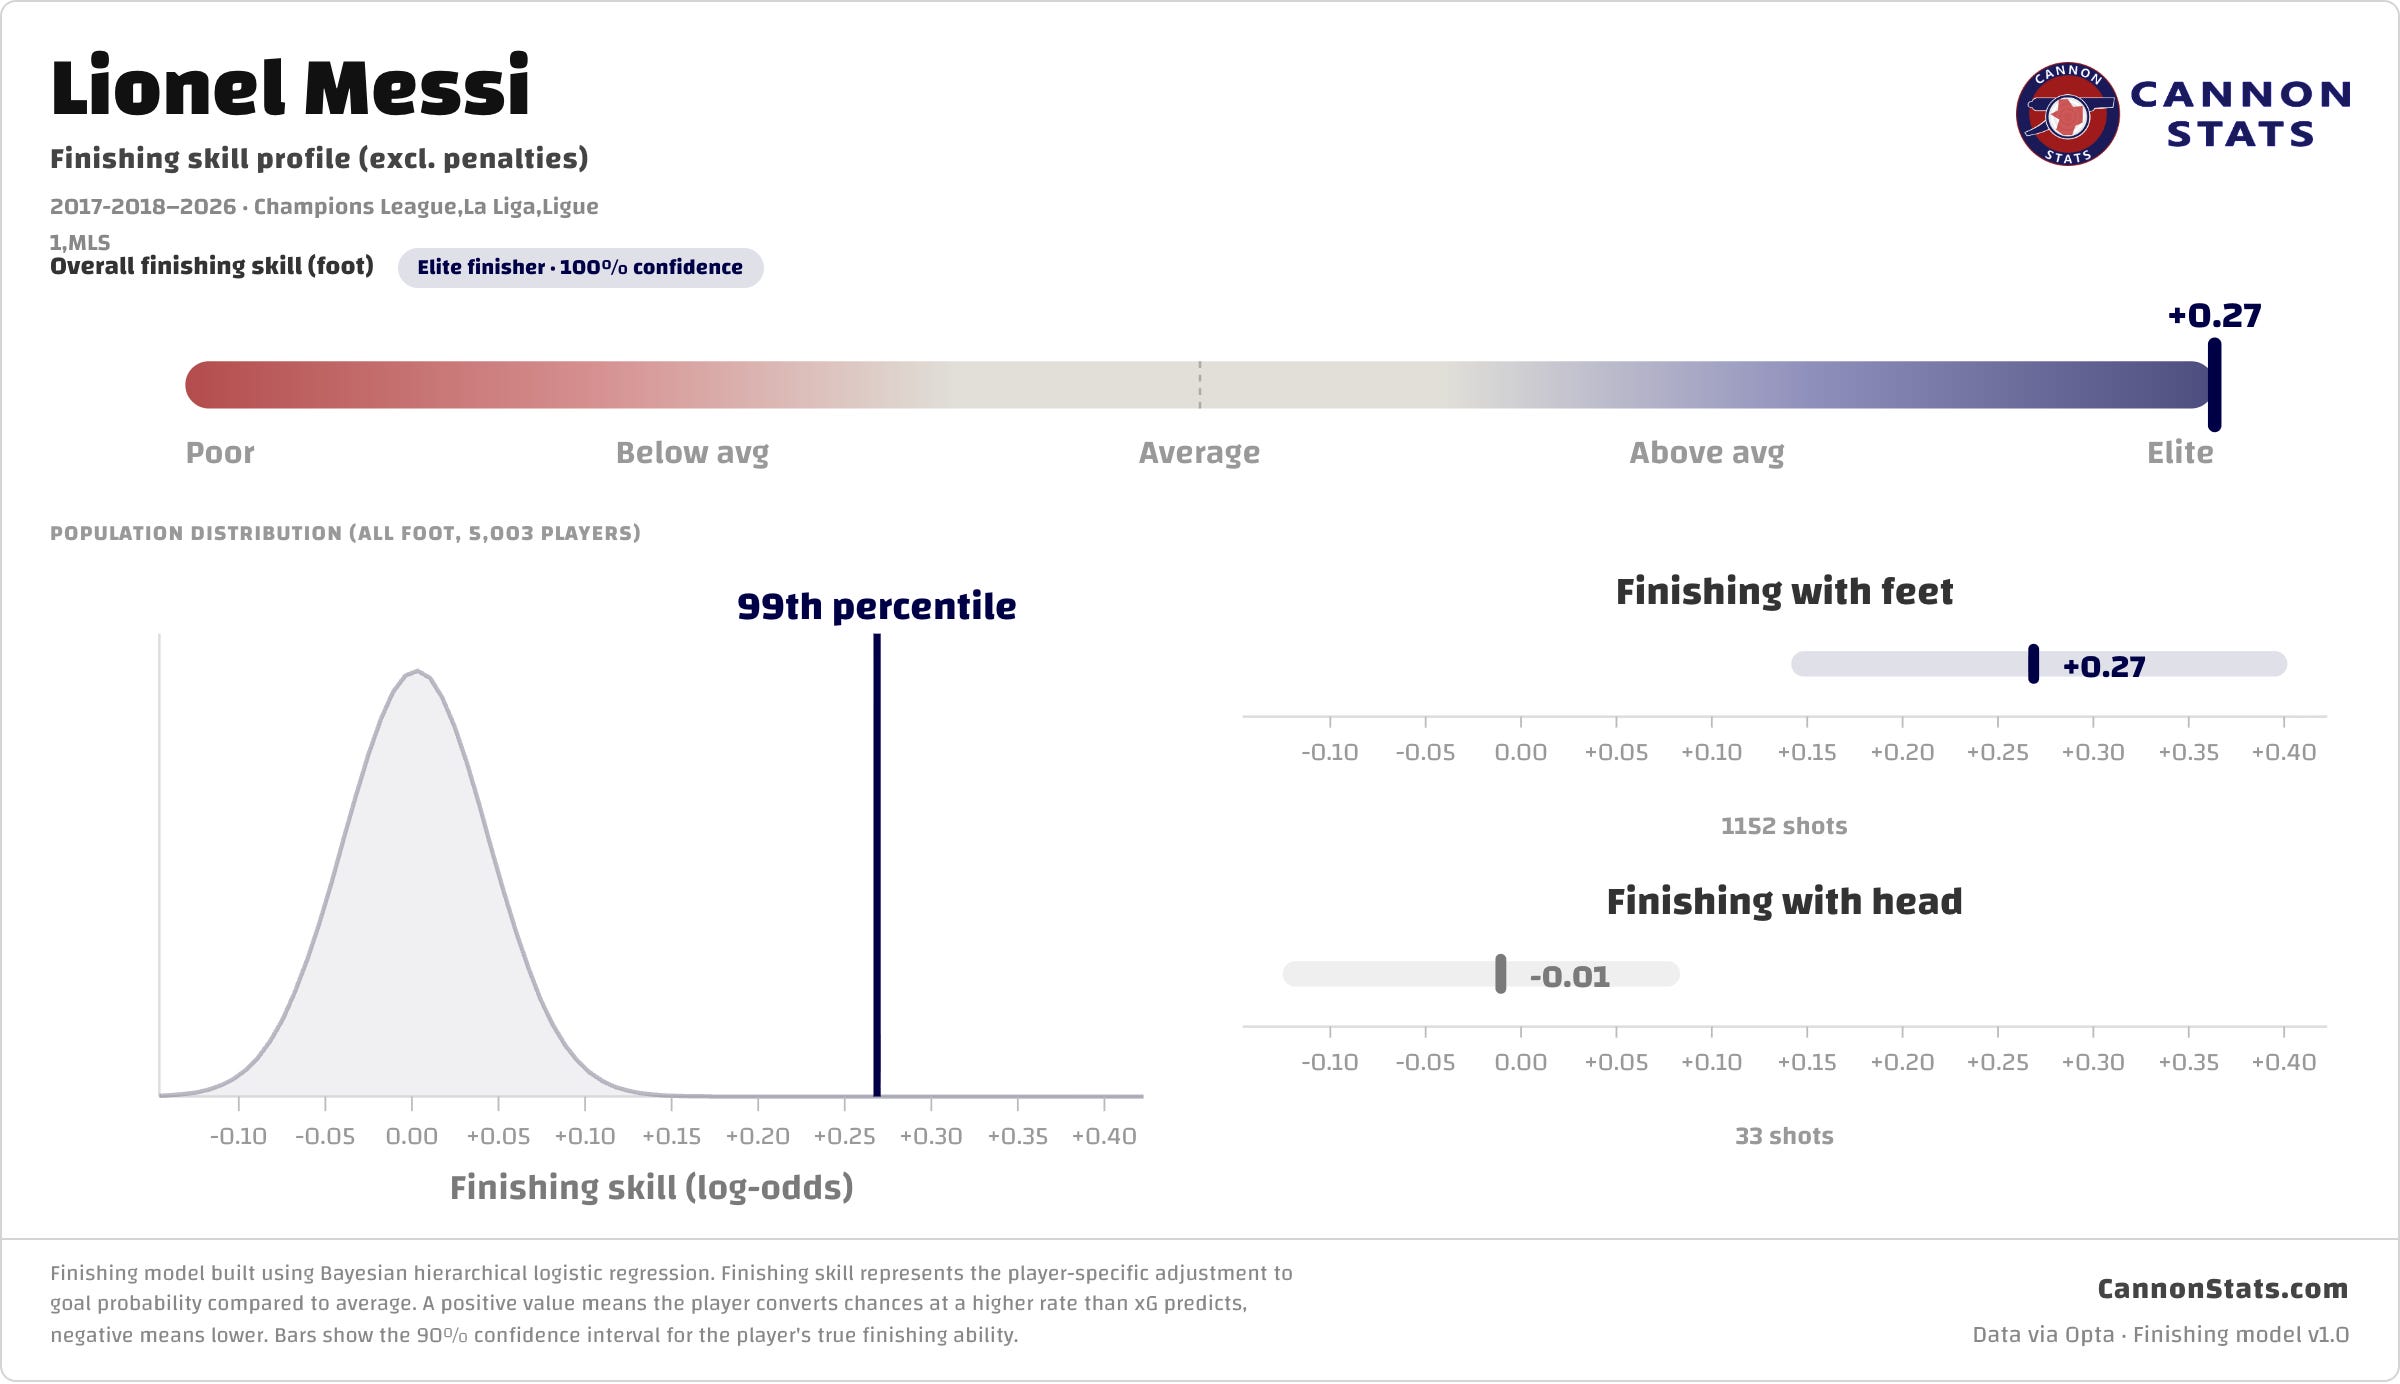
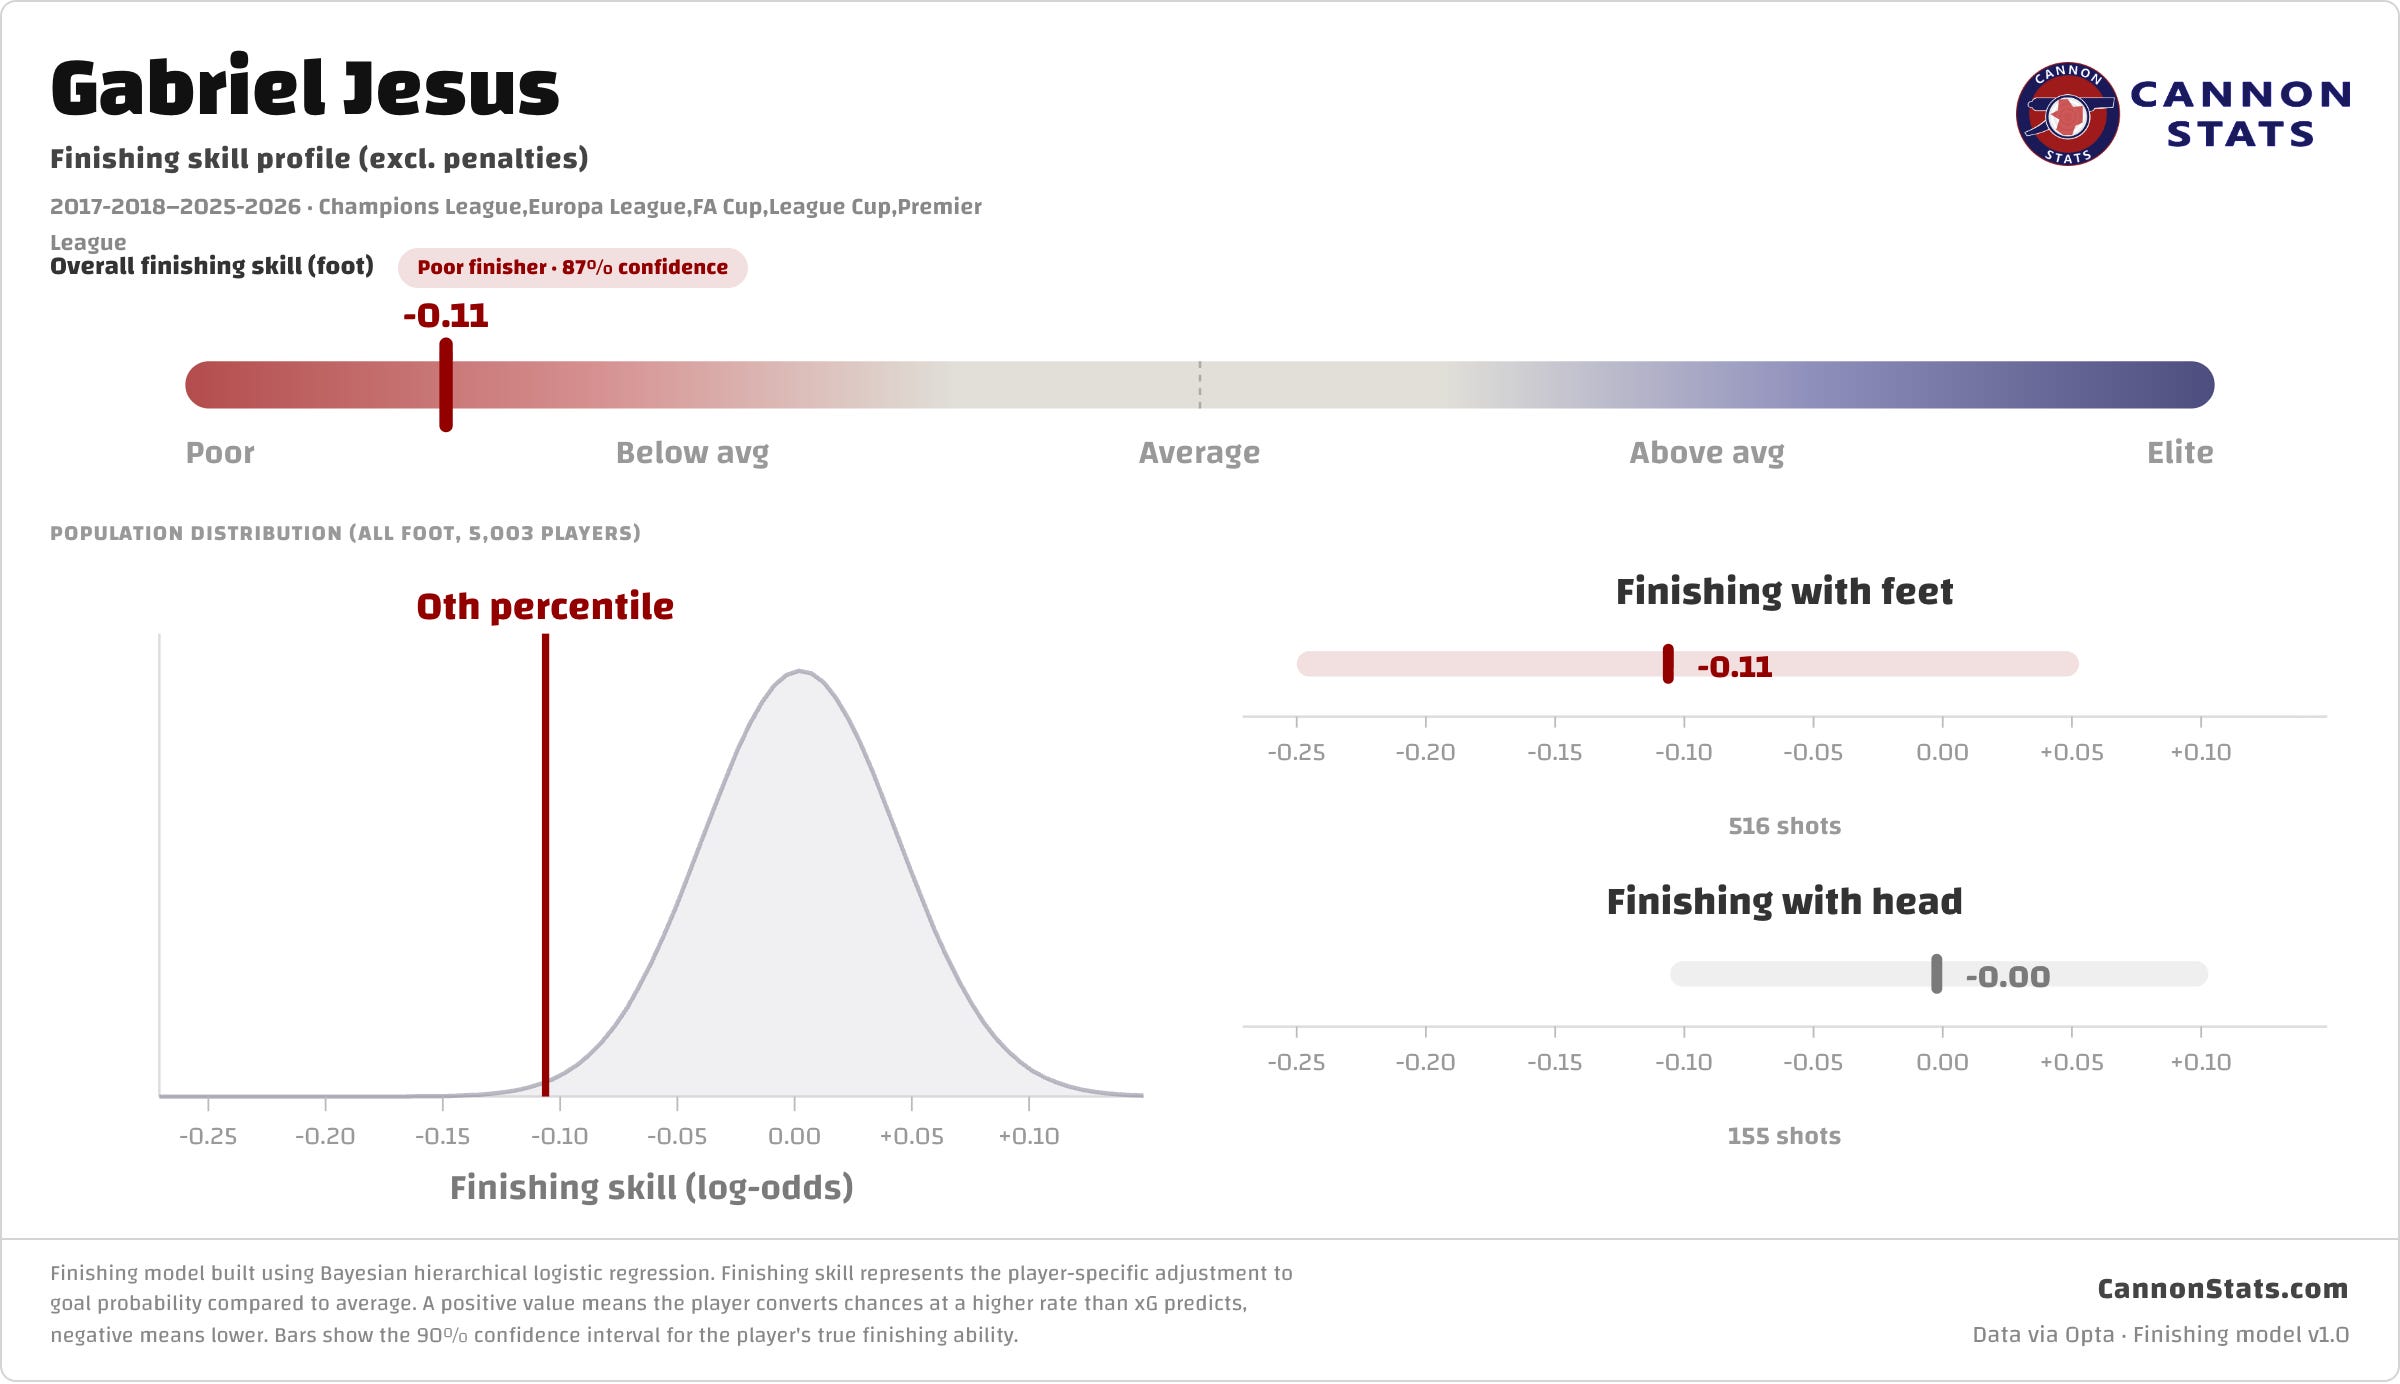
The graphic has three key parts.
At the top, a gauge shows where the player sits on the spectrum from poor to elite. For this I have made average cover the area from +/- 1 standard deviation, Above average is from 1 to 2 standard deviations, and Elite is 2 or more standard deviations above the mean. The reverse is true on the negative side
Below on the left, a population distribution shows how they rank against all 5,000+ players in the database with 30 or more shots. It is a very nice normal distribution type shape.
On the right, two charts break down their finishing with feet versus their head. The bars on the body part charts represent the confidence interval for where the “true” talent lies. A tight bar means the model is confident in its estimate. A wide bar means more data is needed before drawing conclusions.
To interpret this the finishing skill estimate can be thought of as the relative change for that player from the baseline xG. A player that is an elite finisher will be +0.20 and that would turn a 10% chance into a 12%, that’s not a ginormous absolute change but that translates into roughly 2 goals over 100 shots (roughly a season’s worth for a striker).
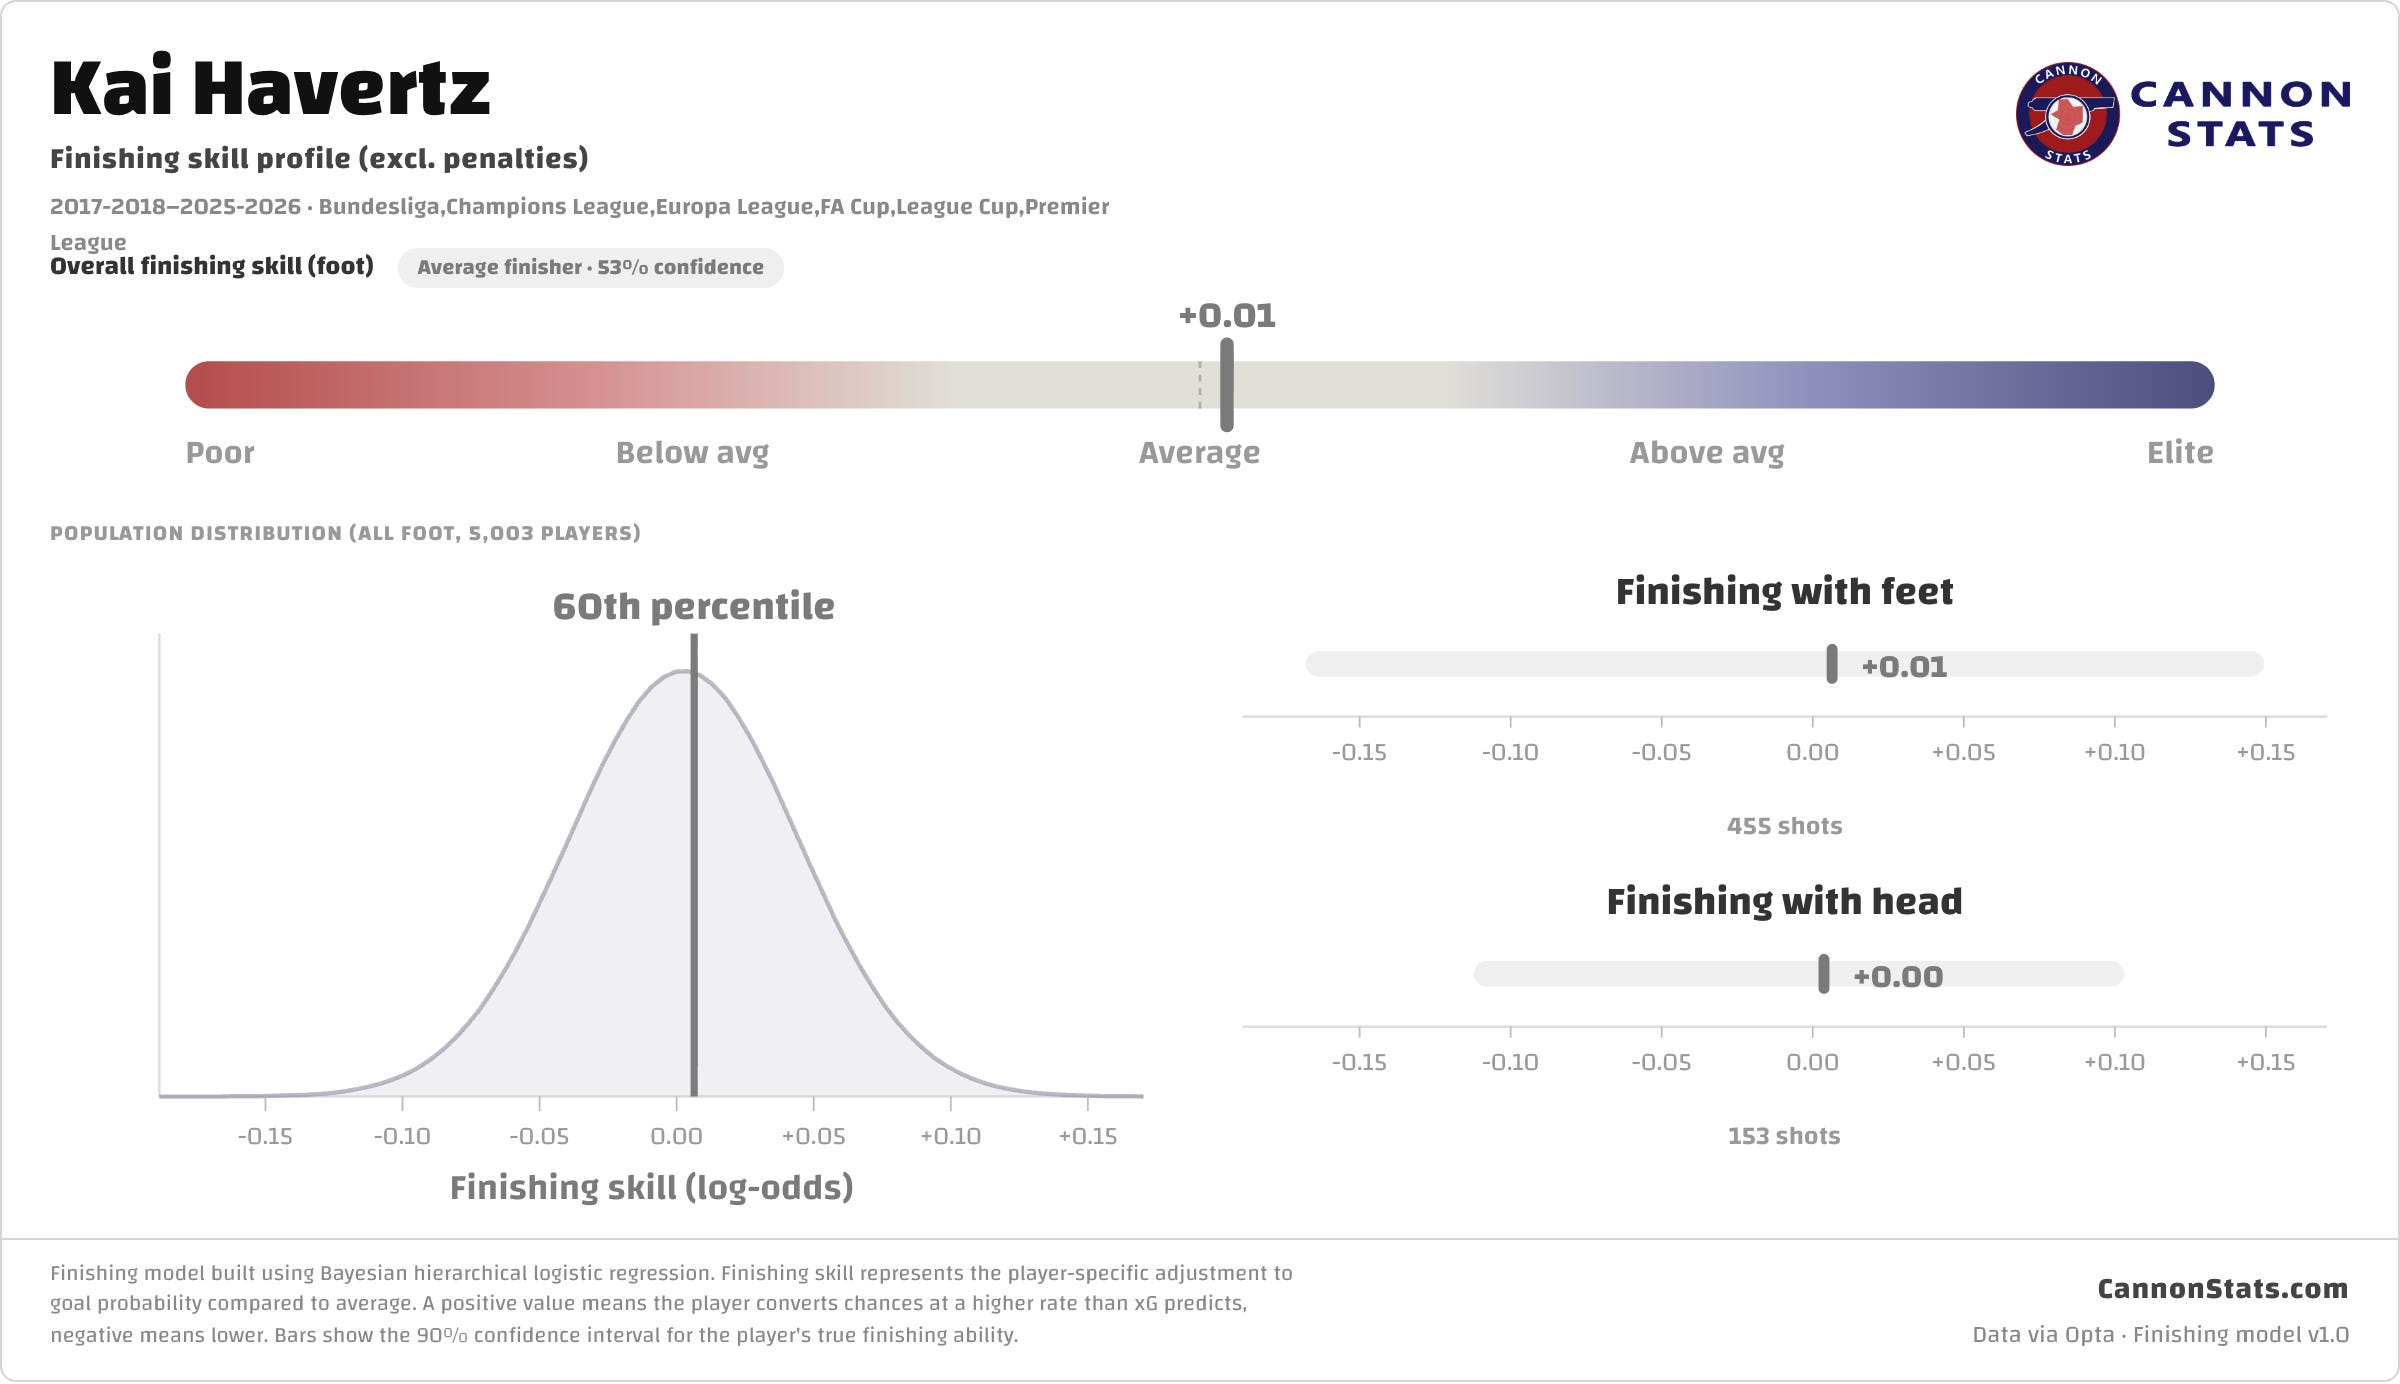
To give a bit more Arsenal flavor, here are the three main center forwards for Arsenal and they give us a nice overall view of what good, average, and poor finishing skills would look like.

Why this matters
Finishing skill is one of the hardest things to measure in football. Goals are rare events, xG is imperfect, and randomness plays a huge role.
A model that accounts for uncertainty and sample size gives you a much better picture than raw G-xG ever can.
For scouting and transfer analysis, the confidence interval is the key output. A target with a strong finishing skill and a tight interval is a reliable bet. A target with a strong GxG but a wide interval might just be on a hot streak. The model separates the two, and helps us identify the signal in a nosy random world, giving us a much stronger view of what is actually player skill.