Should we care about Field Tilt?
What is it and why does it matter (if at all)?
After every Arsenal match I post graphics to describe the match. I have a pretty standard set of graphics that if you subscribe or are on social media you should be familiar with.
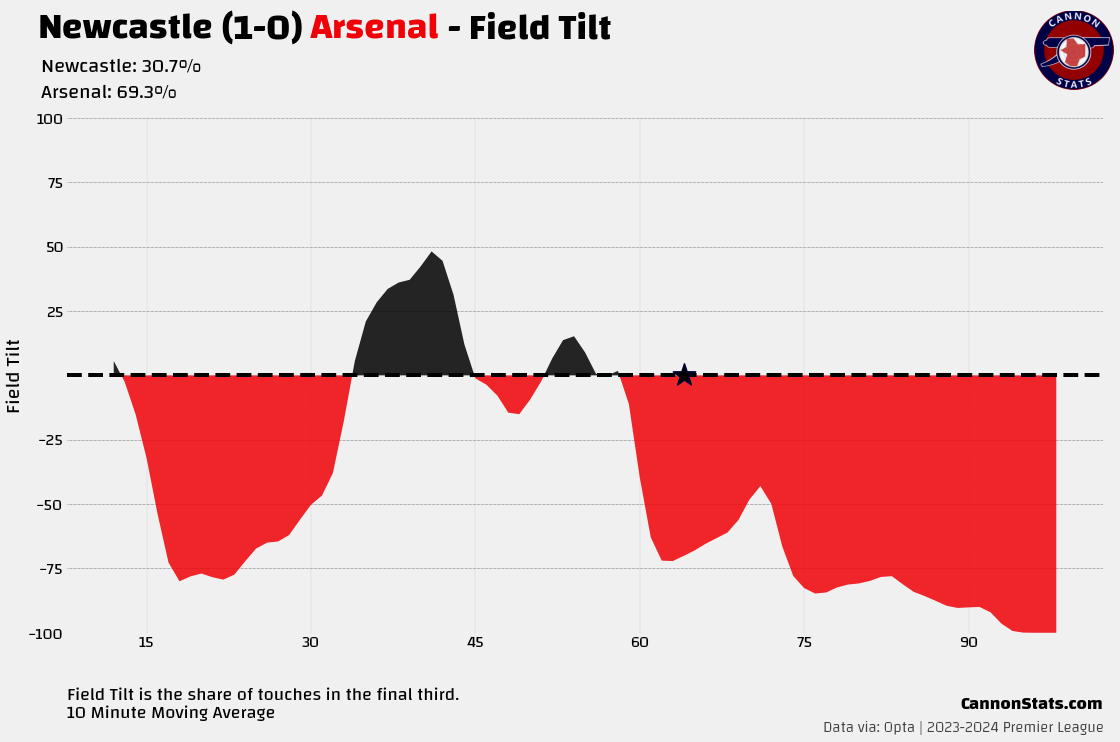
One of them, and the one that is often an area of discussion, especially this season is field tilt. It looks like this:
What this shows is how the field tilt looks over the course of the game, over a 10-minute moving average (the 10-minute moving average is down to smooth things out).
So what is field tilt?
Field tilt is a pretty simple metric, it is simply the ratio of each team’s final third touches compared to the total final third touches.
So if in a match a team has 241 touches in the final third and their opponent has 107 touches in the final third. The first team has 69.3% field tilt (241/(241+107)) and the other team has 30.7% field tilt(107/(241+107)).
This is the same for when you break it down into 10-minute chunks but instead of for the full game, it is just a slice of the game that it is calculated on.
Because this is a ratio it doesn’t take into account the total quantity of touches. So if it was 122 touches in the final third to 54 touches in the final third that would have the same 69.3% to 30.7% ratio that we had above even though that game would look pretty different.
Why use field tilt?
The reason that I use field tilt, or what I look to see from this is to help quite a number and some context around something that when watching a match we have an intuitive sense of.
Field tilt is a pretty good shorthand for understanding territorial control and dominance in a match.
It is obviously not perfect but it does do a pretty good of describing what it sets out to do.
We have all seen matches where a team appears to be applying tons of pressure or keeping a team penned into their own half. We have seen matches that are back-and-forth open matches where each team has waves of attacks and counterattacks but neither have sustained control. We have seen matches that are tight and contested and then after a goal things shift with the team dropping into a more conservative defensive shape.
Field tilt will help illustrate these types of matches and help to back up (or challenge) what we saw with actual numbers.
Inside of this, it is a very good descriptive metric helping to back up and illustrate the narrative of the match.
What about as a qualitative measure?
This is a harder thing to make a determination about.
It is hard to say that in a single match if field tilt is a good or bad or just a thing. It depends on the tactics of the team, and how things unfold.
If you are a team that comes into a match looking to play in your defensive shape and looking to exploit a team making a mistake and overcommitting player forward with a counter-attack, having a low field tilt is expected and if you concede early and have to change tactics and end up with more of the ball and more of the territory it could very well be something that was bad.
If you come into a match looking to control the match and compress the space forcing the team you are playing back and attacking with wave after wave then having a high field tilt probably is a positive indicator that what you set out to do was accomplished.
Looking at Arsenal specifically, they generally have more wins and more points per game with more of the final third possession.
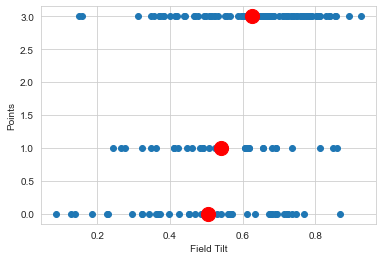
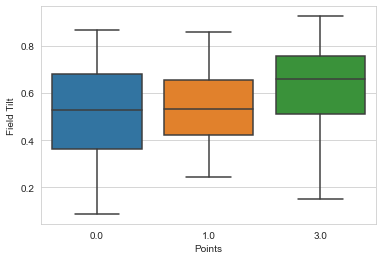
I pulled data for matches going back to the 2019-20 season and in matches where Arsenal win they have averaged 63% field tilt, in draws 54%, and in losses 51%.
Looking at the box plots, it is interesting that losses generally have a big spread (they don’t happen that often and given Arsenal are a ‘big team’ if it is an unexpected loss that can mean a big skew).
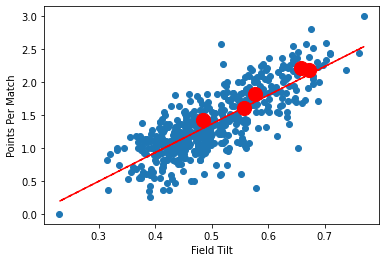
Looking at the season level the relationship between field tilt and points per match is very strong. For Arsenal, this holds as well, as they have gotten better over the last few years their ability (and the respect paid by opponents) to control territory has improved.
The relationship here is strong (0.78 r2) and is on par with or better than other metrics that people also associate with a good team. There are good teams that can play with less of the final third possession and there are mediocre/bad teams that have more of the possession but the general relationship is that if a team has more talent, they will be able to have more of the dangerous possession.
Here are the same graphics with some different key metrics:
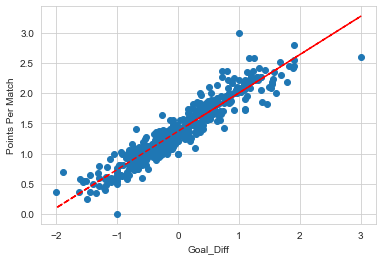
Goal difference:
It is hard to beat goal difference as a measure for how well a team does. You can spoof it some with sequencing and doing better in close games even if you get blown out in others but given that points are directly tied to goals scored and allowed it is not a surprise that this is as close to a perfect relationship that you can get (0.94 r2).
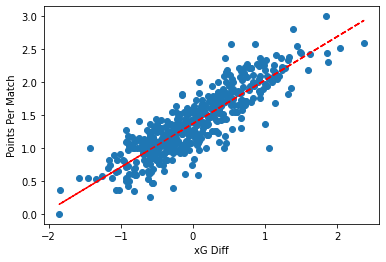
xG difference:
This is a very strong one and it makes sense because this is a direct measure of the chance quality in a match and that would be expected to correlate strongly with results (0.87 r2).
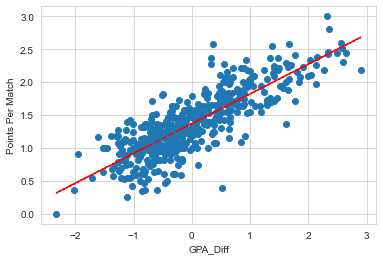
Goal Probability difference:
I am very happy to see that goal probability also has a strong relationship with points per match. Goal Probability Added is looking to measure how on ball actions add or subtract from a team's chances of scoring and it looks like it does show up well as a high-level indicator of how well a team is doing (0.83 r2).
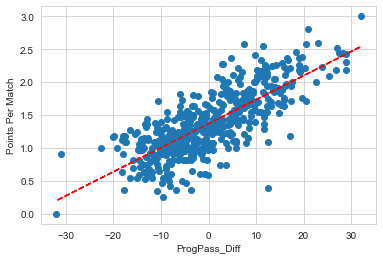
Progressive Pass Difference:
Progressive pass difference is another metric that shows a positive correlation but it is less strongly associated with points than field tilt! (0.76 r2).
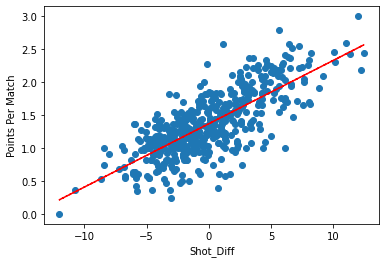
Shot Difference:
Shot difference is a positive correlation but it is less strongly associated with points than field tilt! It is also a pivotal factor that putting in a measure of the quality of the shots taken makes this a much more robust indicator. (0.75 r2).
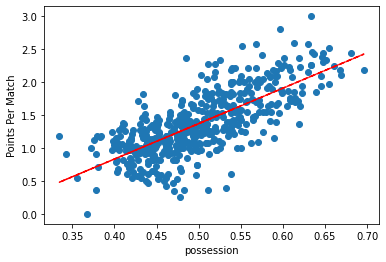
Possession:
Possession is similar to field tilt but looks at the whole field rather than just in the final thirds. The relationship is strong but again not quite as strong to focus only on the final third possession (0.72 r2).
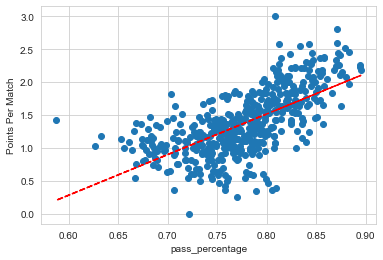
Pass Completion Percentage:
Pass completion is a metric that I think is also associated with team quality but it is much more dependent on team tactics and that makes it more variable as a metric for predicting how often a team earns points (0.64 r2).
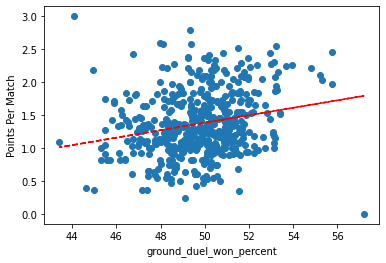
Ground Duel Win Percentage:
How often a team wins their duels is not heavily associated with winning. This is an interesting finding and one that goes a bit against the cliches about the team that wins their duels and wants it more win more often. It does have a positive relationship but it is not very strong (0.22 r2).
Final thoughts
Like all stats, it should be used to help describe what it is intended to measure. With field tilt that is the territorial dominance of a team and with an in-match graphic how the game flowed and was affected by the game state.
On its own, it doesn’t say if something is good or bad, or if a team played well or didn’t. For that you need additional context (or use field tilt to provide additional context for other statistics about a match)to understand how a team set up and what their plan was for the match.
On a longer horizon looking at multiple matches, field tilt is a strong indicator that is associated with earning more points per match. This can help indicate if a team is doing something different than other teams that earn similar points, but again on its own it probably doesn’t tell you if it is good or bad.
I hope this is helpful, please let me know in the comments if there is more clarification needed or something I missed.


Nice work, Scott. I’ve been curious about the relationship between field tilt and outcomes, this was a great explainer. It does feel like teams are sitting deeper and deeper against us, making it tougher for us to score. So maybe there are limits to which increasing field tilt drives incremental gains in shots/xG/points depending on how teams set up, or how quickly we’re able to “tilt the field”, etc
Thank you Scott. High-quality and well-written as always. You & Adam have a real talent for this. (I did a stats exam over 30 years ago in another life, and what little I've remembered often comes in useful, especially the maxim "correlation is not causation". I wish this was drummed into people much more.) PS: please don't let your podcasts with Adam slip. There are my absolute favourite of this genre. I am avid follower of the likes of AVision et al. but prefer yours and Adam's Friday discussion to anything else out there. Keep up the good work.