Thinking about uncertainty
One of the most common complaints about xG I hear is about the ratings of single shots.
My common refrain is that for a single shot the error bars should be in the range of plus or minus 25%. This matches pretty well with work done by @WillTGM who estimated that at the 90% confidence intervals a single shot was in the 10-15% range, with things dropping to about +/- 5-7% at 100 shots, +/- 2-3% at 1,000 shots and then settling into +/- 1-2% at 5,000 shots.
With this, I thought it would be good to think about ways of illustrating this uncertainty. We present these graphics and numbers with decimal points (sometimes even into the 2 decimal range, I know I can be guilty of that at times) that present a level of certainty that is not warranted, especially at the single-game level.
So with inspiration from what others have done before, especially Martin Eastwood (@penaltyblog) I have made some adjustments to my standard xG vizualizations.
The new running xG Graphics
First this is what the old one looks like:
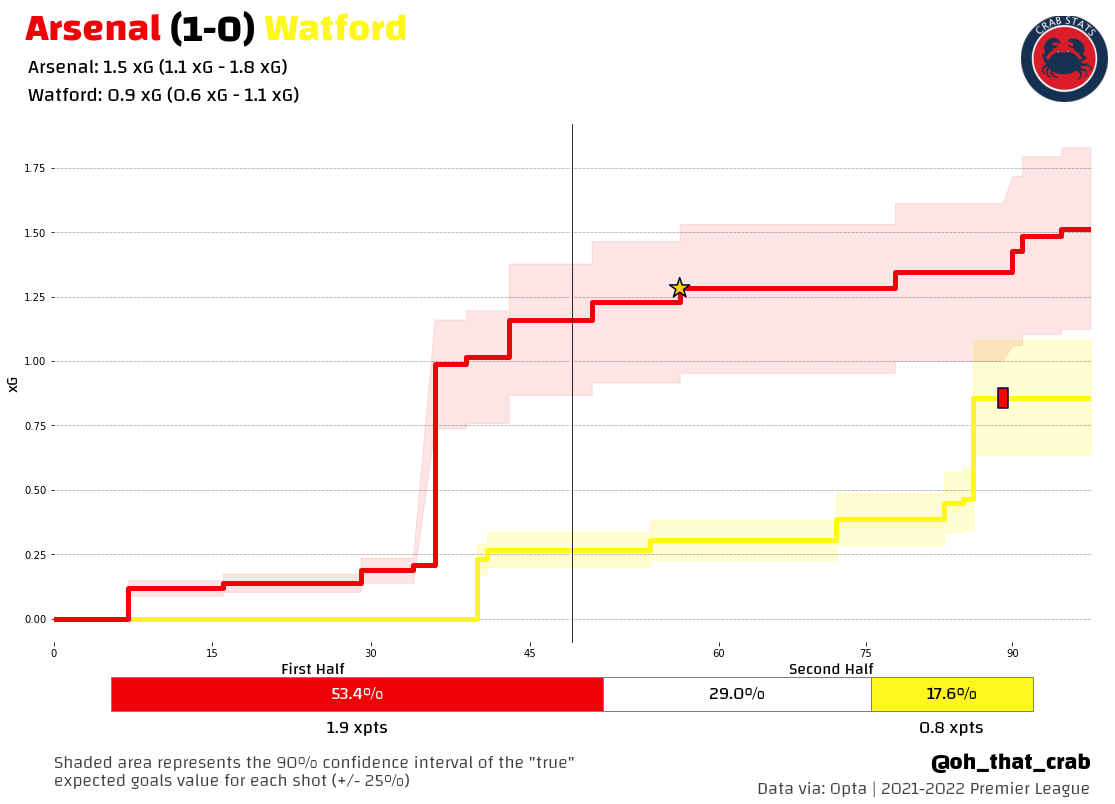
And here is what the updated one looks like.
I had made a few changes here, first I have changed my default font style because I got bored looking at the old one.
Second and more importantly, is the addition of the confidence intervals for each shot. I have gone with a bit more uncertainty in these sticking with the +/- 25%. The top end of shots is obviously still capped so that a shot cannot have a value greater than 1, so with really big chances the low end will be larger than the high estimate.
I have also added the low and high estimates range to the sum at the top, to make seeing the level of uncertainty more clear.
Overall I am quite happy with how this looks and the extra information that is presented seems intuitive (if it isn't or more information is warranted please send me a message).
The third thing I have added is the simulated match result from the shots. This is originally inspired by what StatsBomb and something that I had before when I was still making these from excel.
The simulated match result is a Monte Carlo simulation where for each shot a random value between the low estimate and high estimate (at the suggestion of @elliott_stapley, which is much appreciated) is chosen and then compared to a random number to simulate goal or no goal. These are added up and then the goals scored are compared to give the probability of home win/draw/away win. From these, I have also derived expected points for each team.
One of the things that using the low and high estimates does for these simulations is flatten the odds slightly and I think that is probably a good thing to reflect that there is more uncertainty than was reflected in the regular xG values. I am happy again to have spent the time to get this into the visualization and I like the current presentation.
Thanks for reading and if you have any suggestions I am always open to hearing them.


