
Updated Stat Explainer
Adding some new stats to the tool box.

I have been teasing this for a while but now I am going to through some of the updates that I have been able to roll out to my stats. This is also a good opportunity to give a bit of a what is out there and what it all means.
I am still finishing up the final collection and cleaning process but I should be fully moved over to all of the new data by the start of transfer season and with the advances in coding assistants we might even be getting some new webapps (currently in a limited beta but planned for a wider release as we get into the summer) that take this advanced data and the different graphics that I have put together over the years.
More information as this develops, in the meantime here are the new items we will have access to.
The “Shooting Zone”
For the attacking on ball events, I have simplified them into 3 different categories, they are pass, shoot, or duel. I then looked at the probability of each of these for the zones across the pitch.
The main purpose here was 1) to satisfy my curiosity, 2) try to refine the area that is especially valuable for shooting.
We track penalty area touches and that is good but not all touches in the penalty area are in a good location to shoot from. That would be the same with my “deep touches” which is a semi-circle 25 yards from the center of the goal. There are still helpful things to understand and show a player in a dangerous location, but it is less tailored towards answering the question of how often does a player or team get touches in good shooting locations.
This shows the probability of an on-ball event being a shot from each zone, with what I am calling the “Shooting Zone” highlighted.
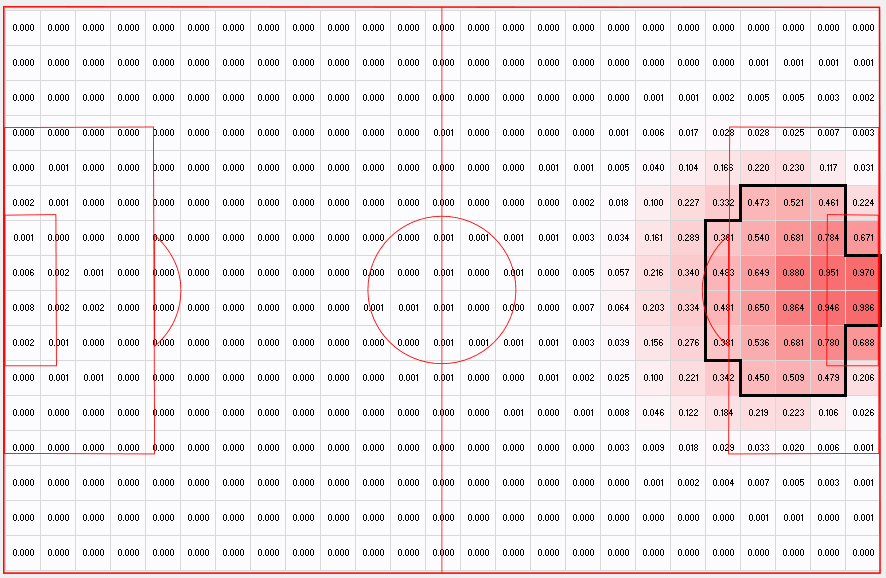
I took a bit of creative license here when defining the boundaries, favoring zones that are more central but overall, I wanted to capture the areas where a shot was very likely to be attempted. I set the threshold at roughly 40% and gave a bit of leeway to the zones just around the “D” because these were close to that level and they were in my central area that I care about.
This is a bit of a throwback reference, but it is basically the inverse of the “Andros Townsend Force Field”.
For this area, I will start looking at pure counting stats for touches, passes completed, and passes received into this zone, plus how well a player/team converts these touches into shots/xG/Goals.
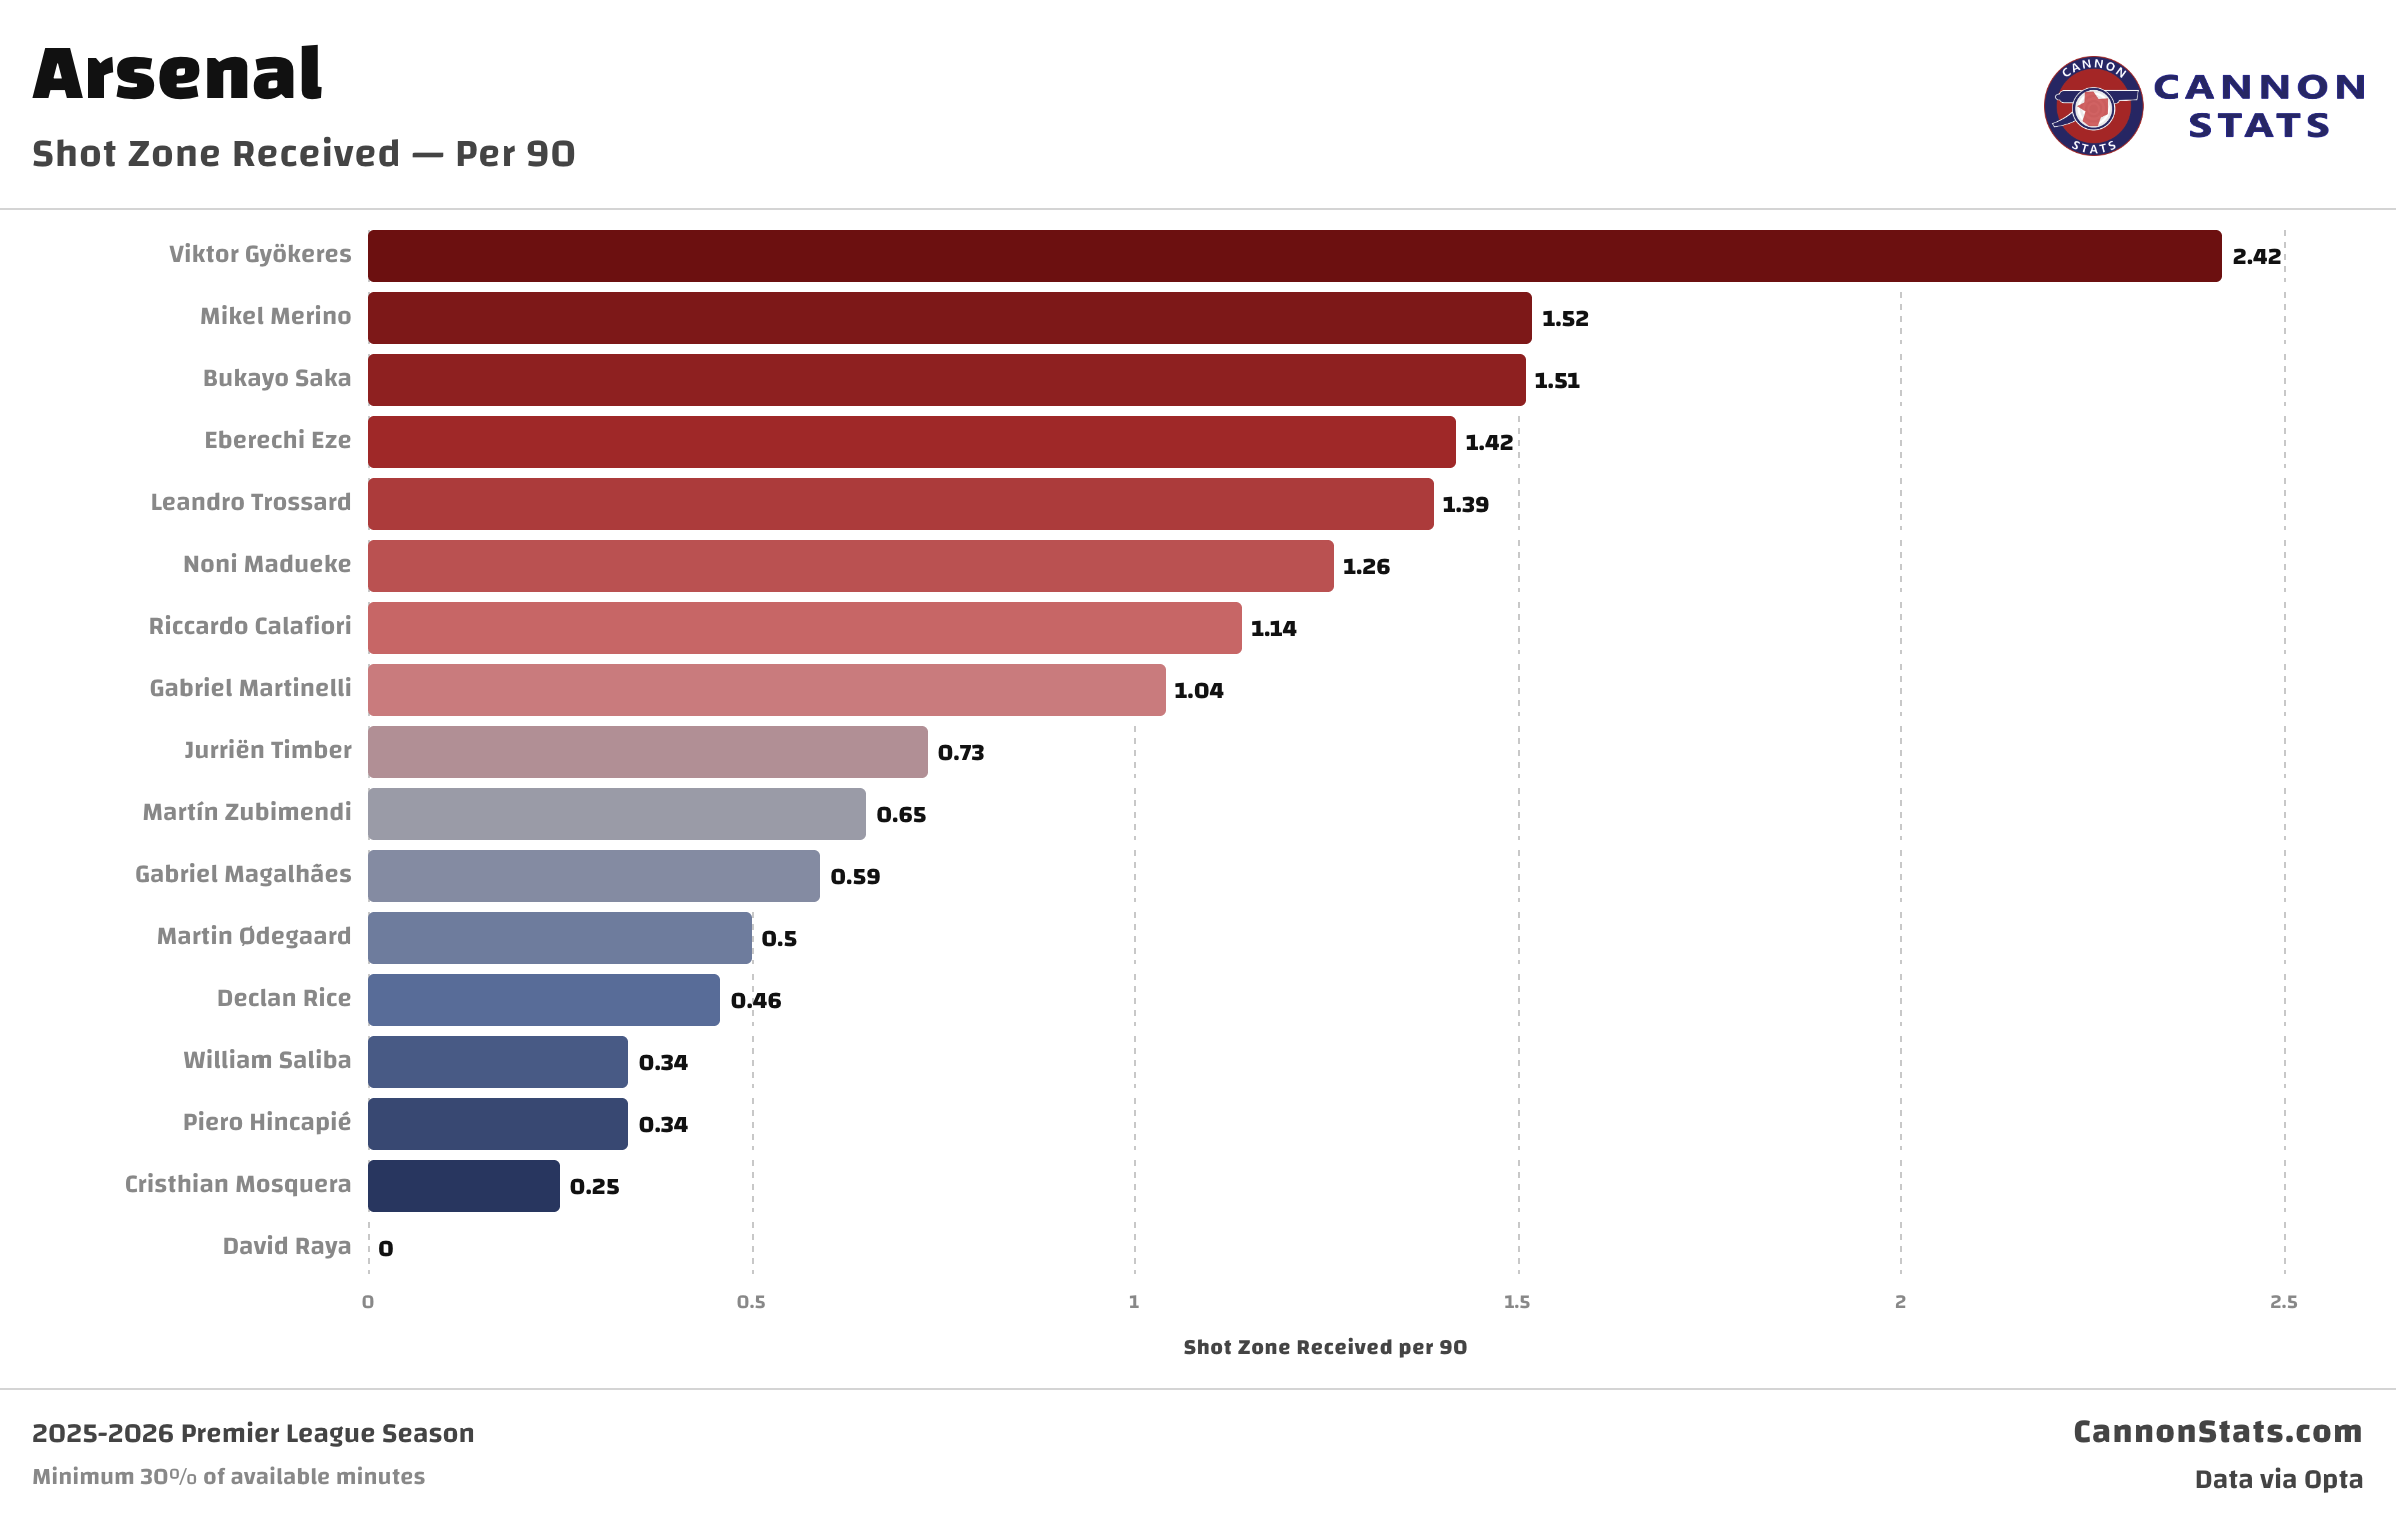
I think that this can give light on how a team plays as well, looking at how they get into these locations, is it pullbacks, through balls, carrying, central penetration/combo play, crosses?
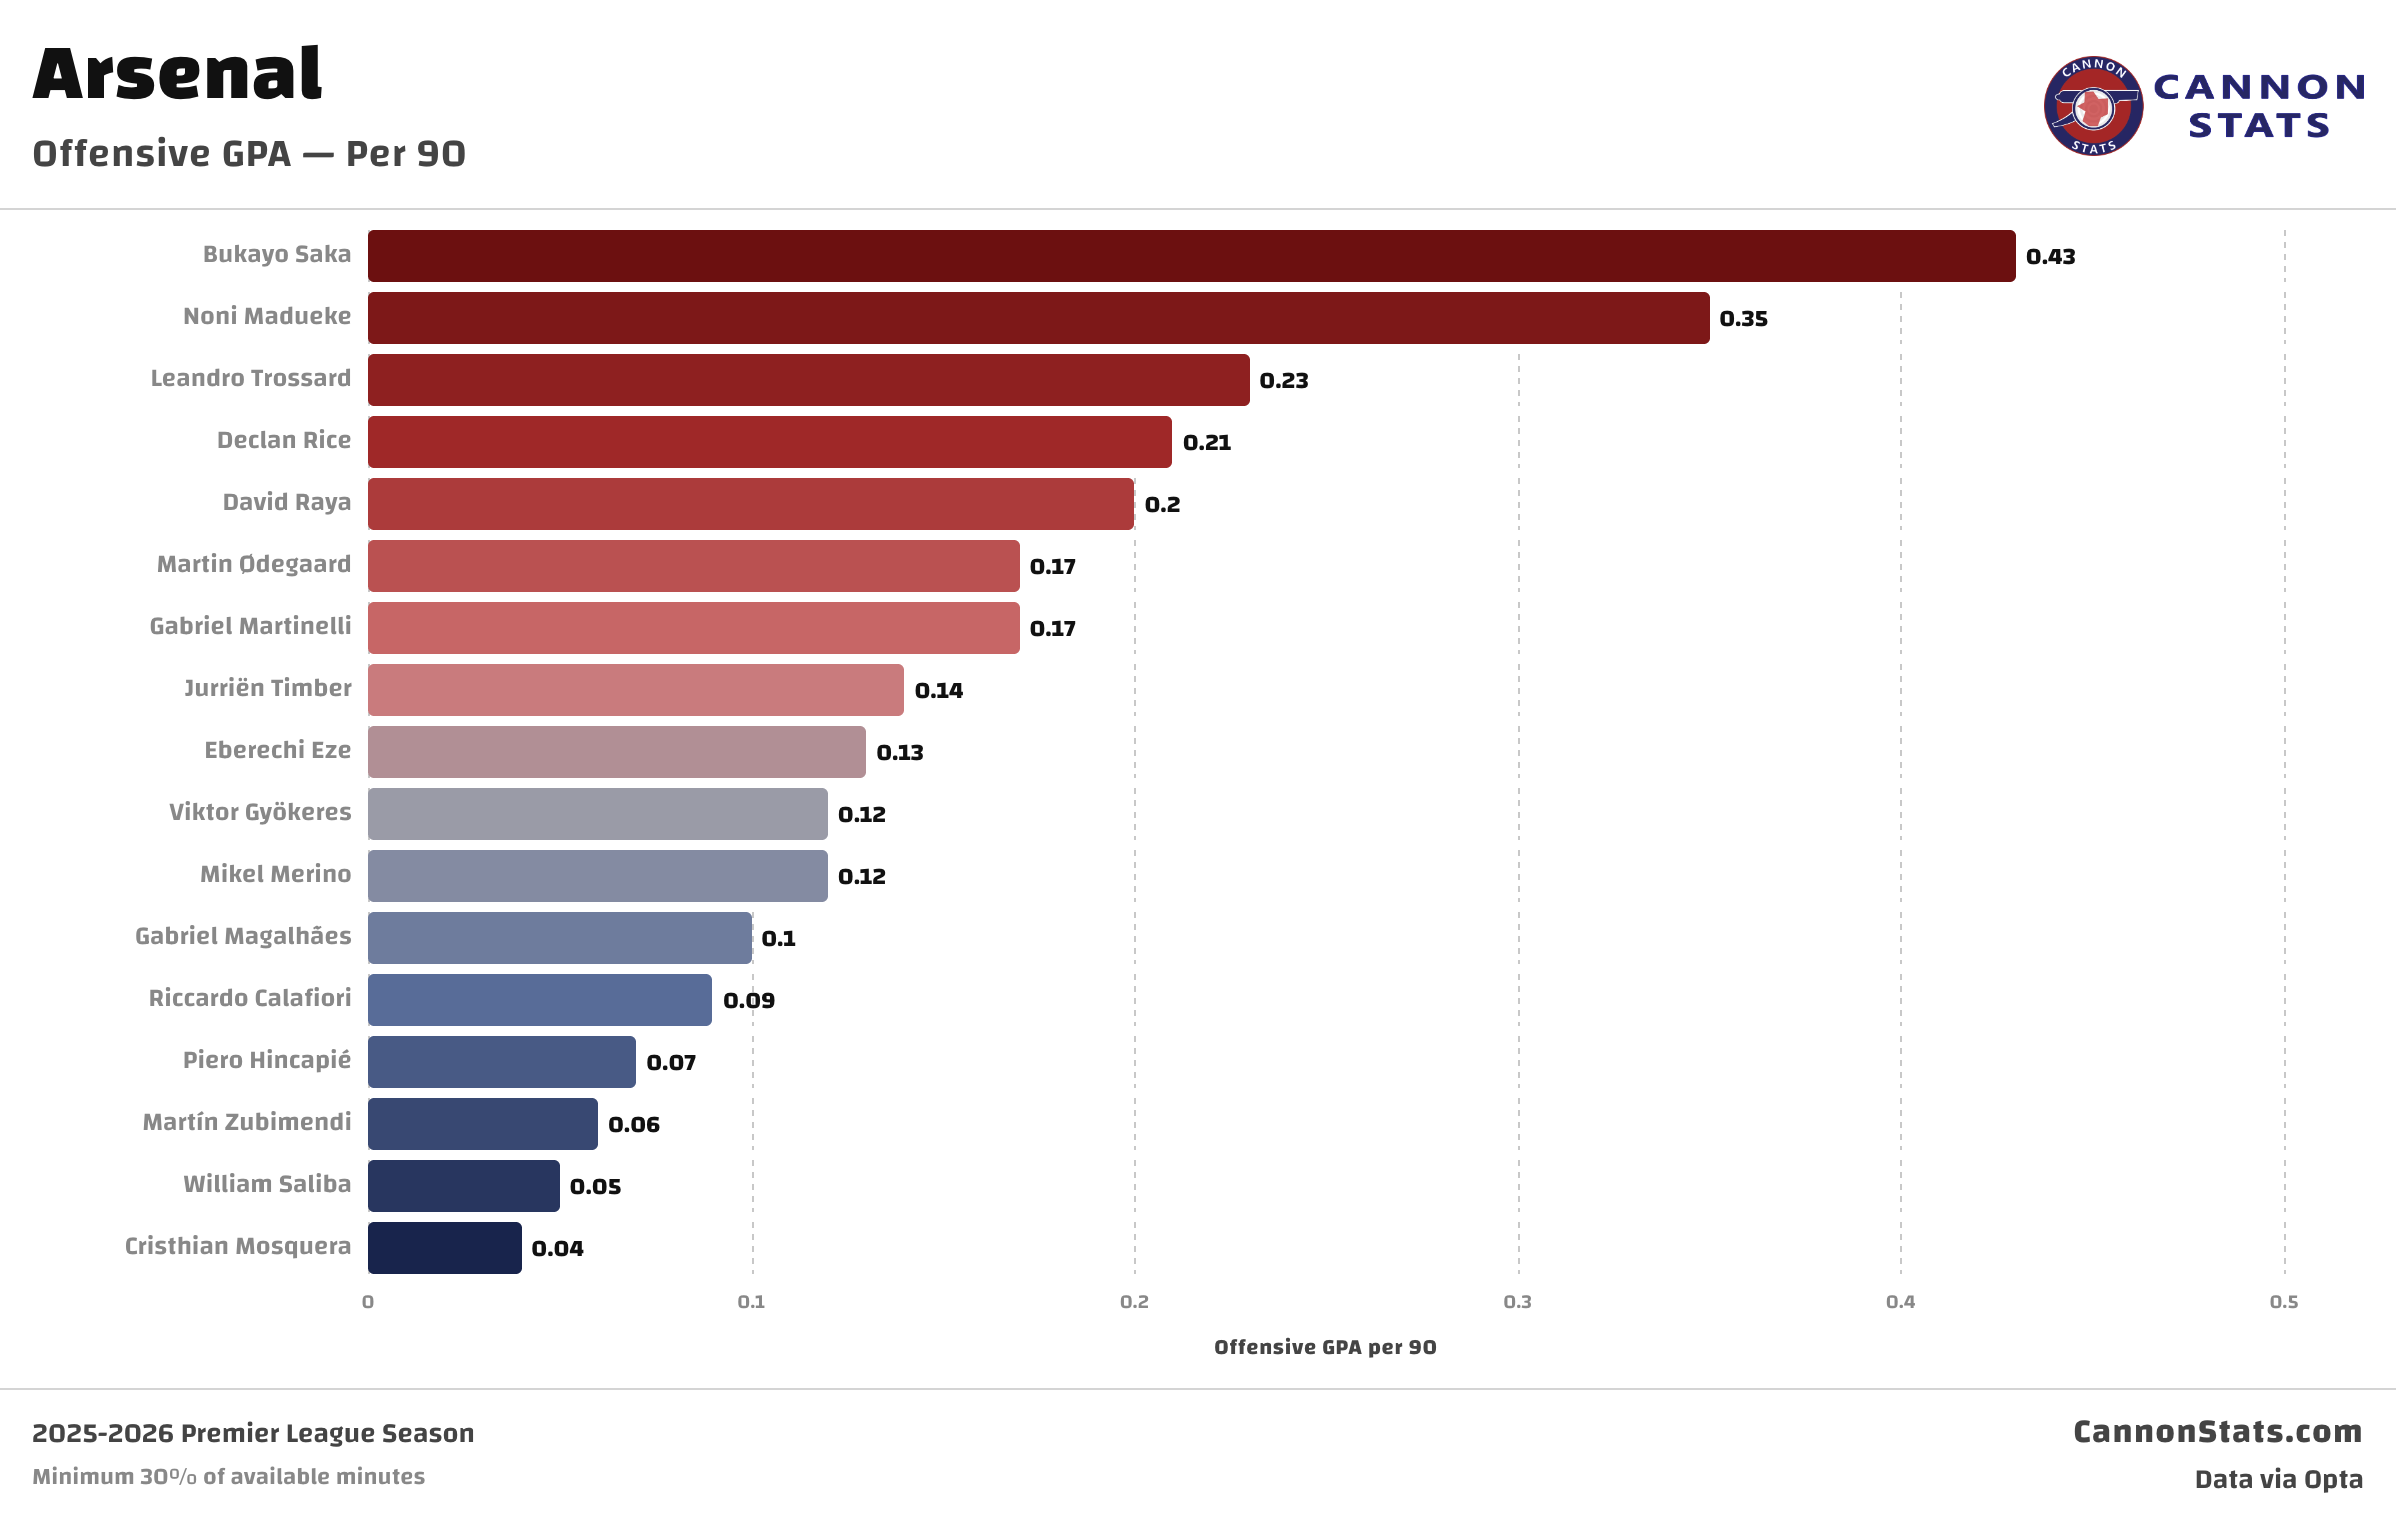
Goal probability added
This isn’t new, but if I am going through and talking about things it is always good to explain this a bit more. Goal probability added is my version of a possession value model, it is in the same family with metrics like VAEP, g+, or on-ball value and should be relatively close to these.
The idea here is looking at the net change from each action on a team’s chances of scoring or conceding a goal in the current sequence plus the next sequence.
Because I am a simple man, I have stuck with the tried-and-true zone-based system. This can have issues with thresholds, for example a pass or carry inside of a zone entirely will show no change but something that moves just across the boundary that is nearly indistinguishable in every other way will be treated differently.
Ultimately, I just decided I am okay with that and that in the aggregate they will likely washout. I have also tried to minimize the occurrence by adding more zones, increasing the resolution of the pitch, for this the field is broken into 400 zones (25 by 16), that translates into roughly 4.2 meters by 4.25 meters rectangles.
This is how the probability of scoring looks across the pitch.
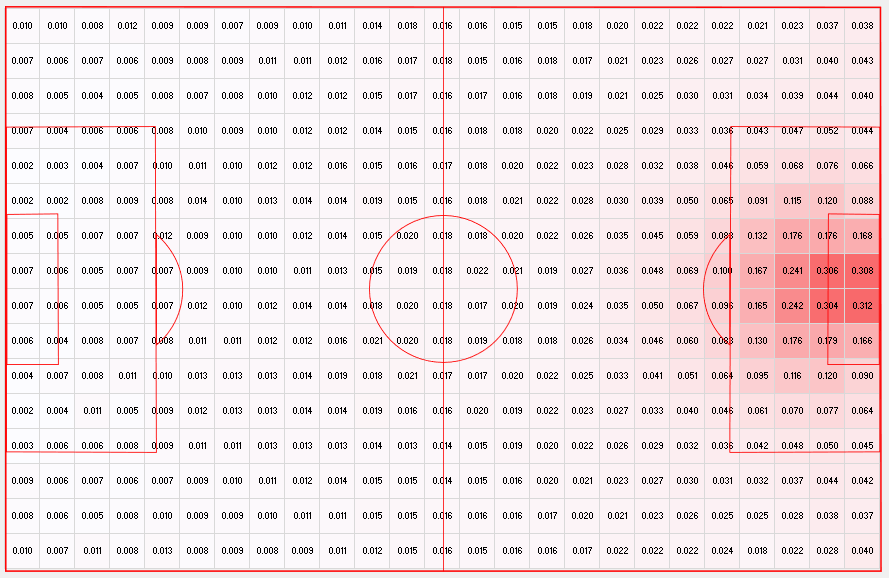
If you have seen the value of the different areas of the field before this shouldn’t surprise you at all. As you get further from your own goal, and as you get more central, the chances of scoring increase.
This is how the probability of conceding looks.
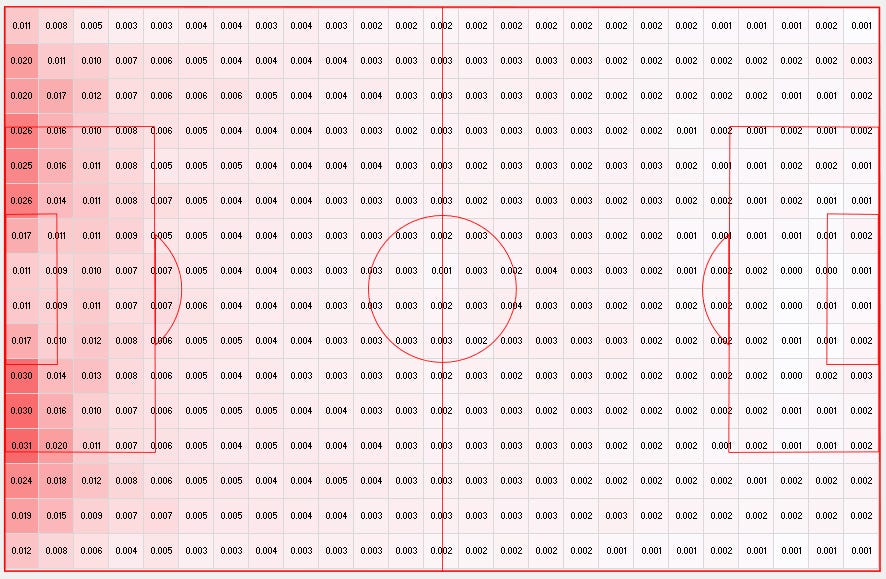
This one is a little more interesting and it is probably something that you would have been less likely to have seen before. It matches intuition in that the closer to the goal you are defending, the more likely you are to concede but it isn’t nearly as centered on the goal. The half spaces are actually a bit more likely to lead to the other team scoring than central locations.
Expected Threat
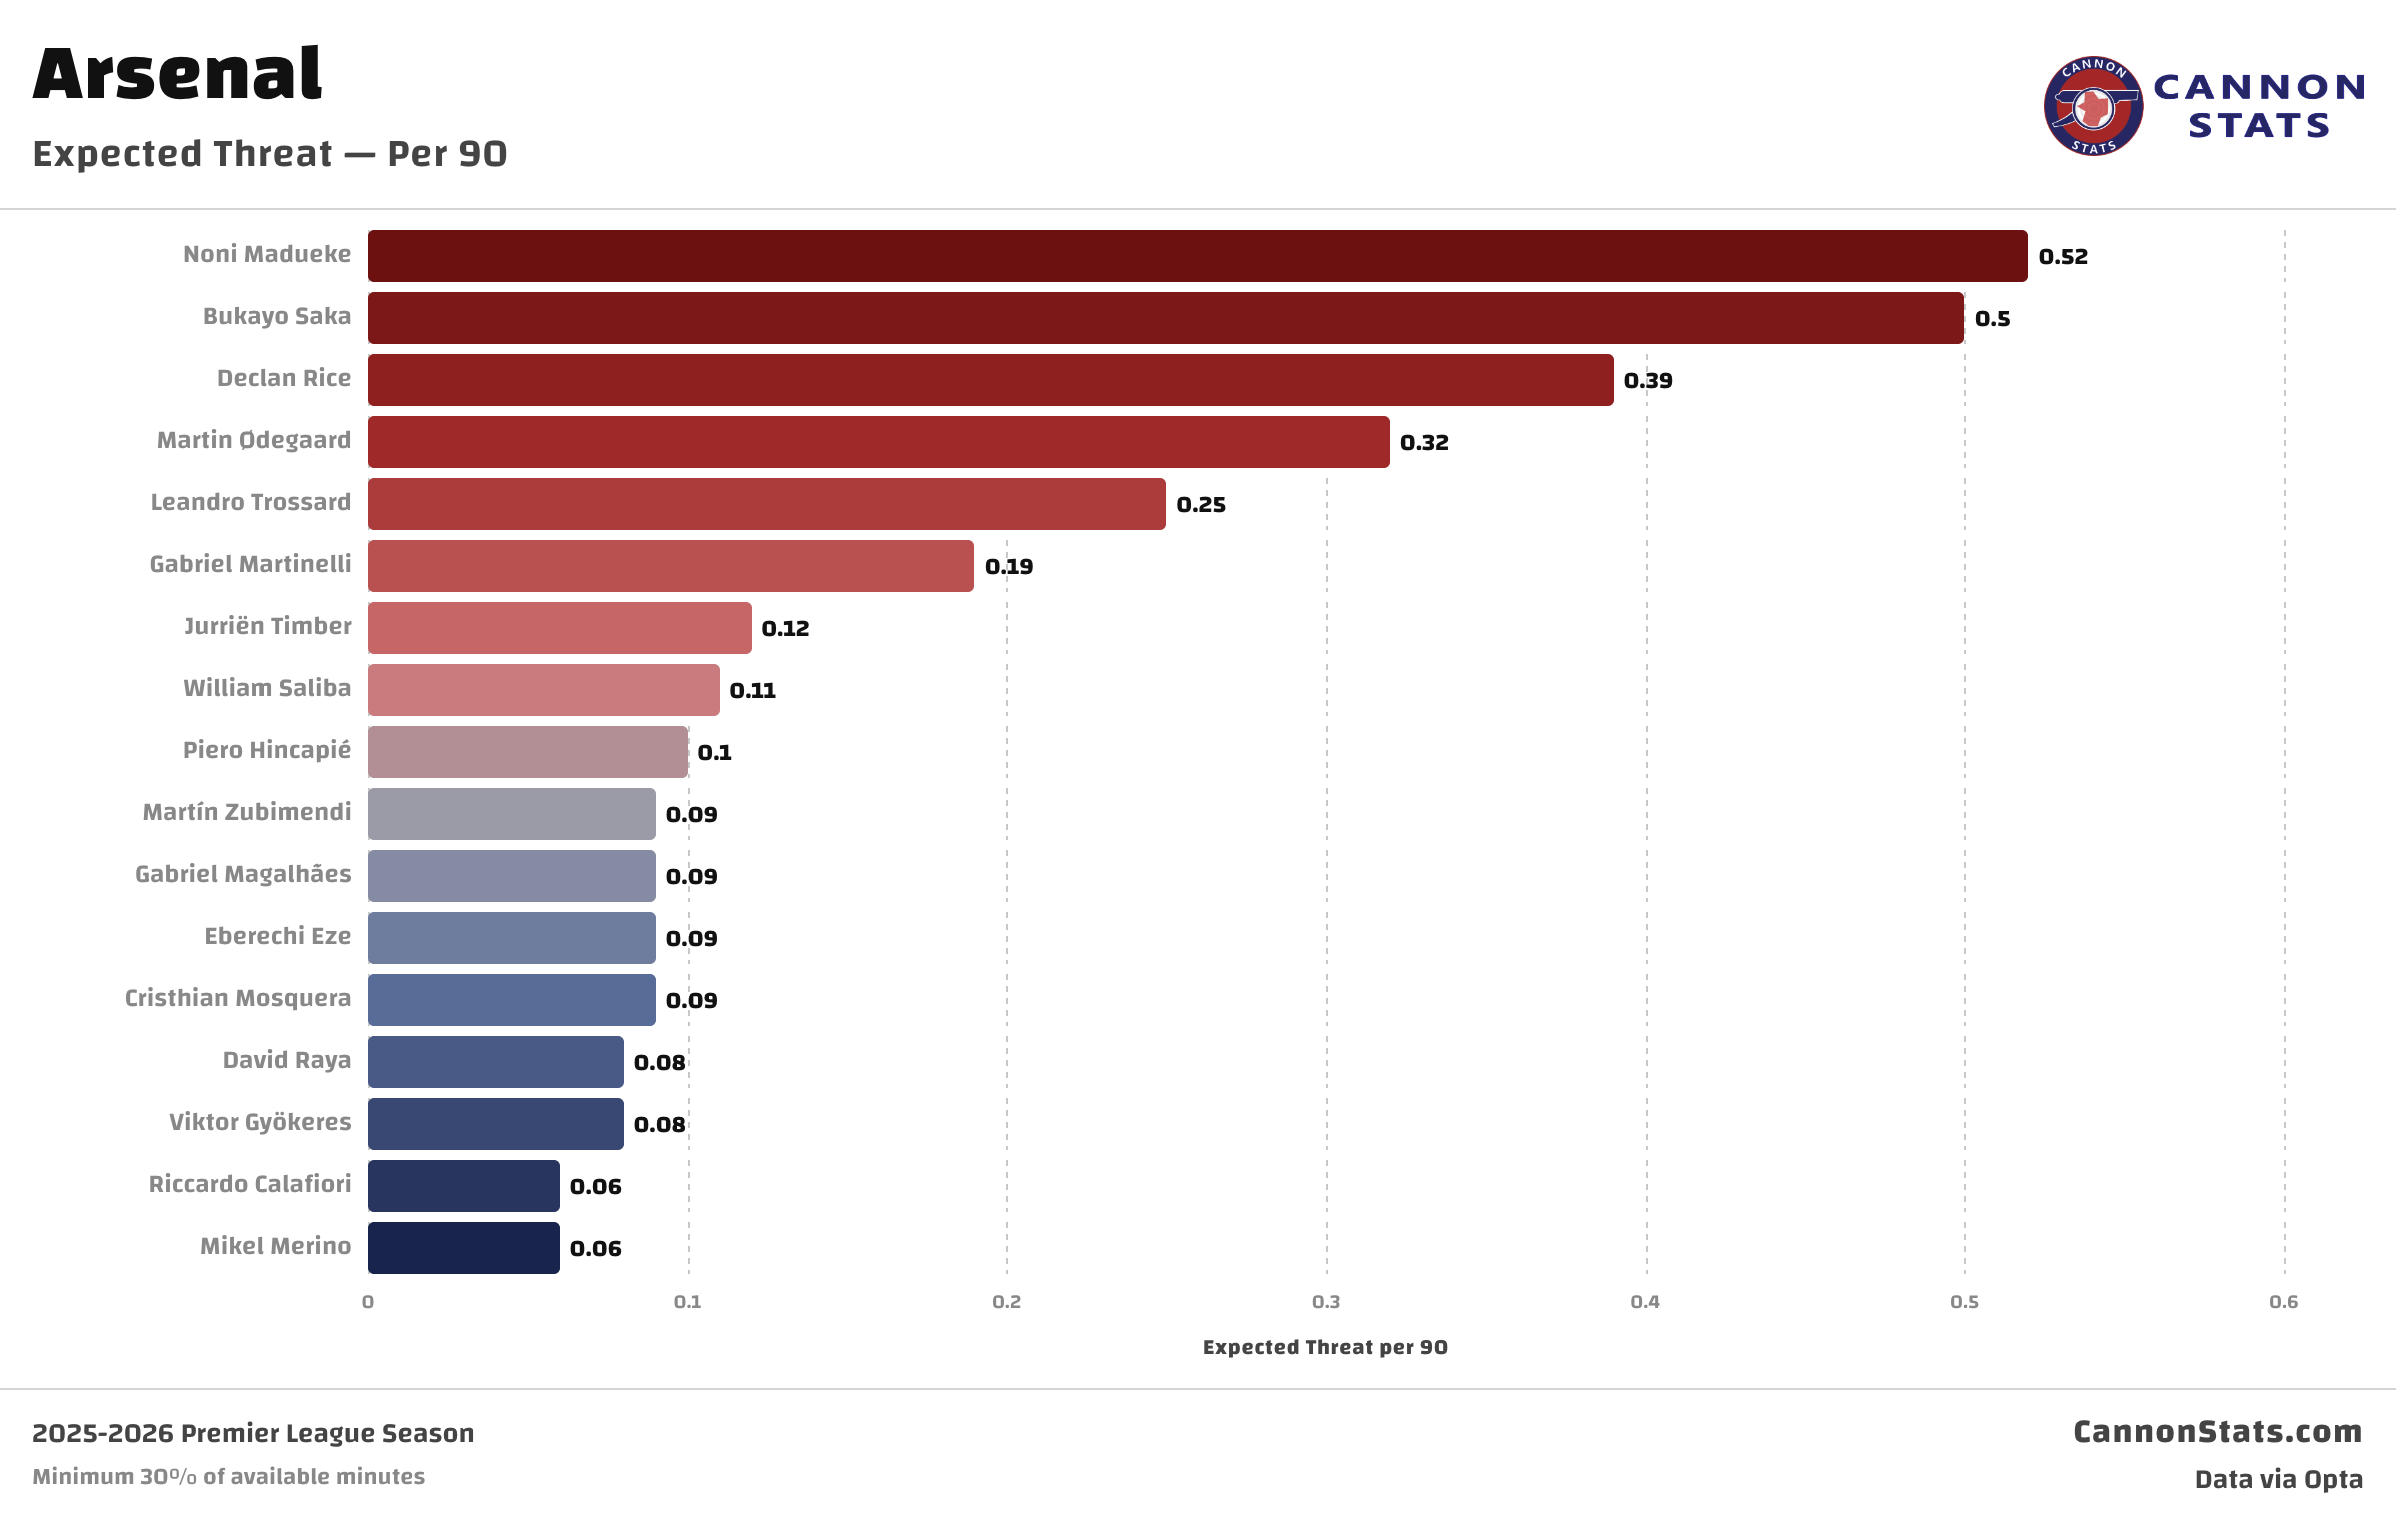
This is another stat that if you are familiar with more advanced metrics, you will be familiar with. I figured I was updating how I collected and processed my data, it would make a lot of sense to add this as well given the popularity and spread of this metric.
Expected threat shares quite a lot of similarities to goal probability added, it estimates the probability that the team on the ball will score in the next five actions from each zone, but it ignores the oppositions chances of scoring.
This is how the probability of scoring looks across the pitch from an xT perspective.
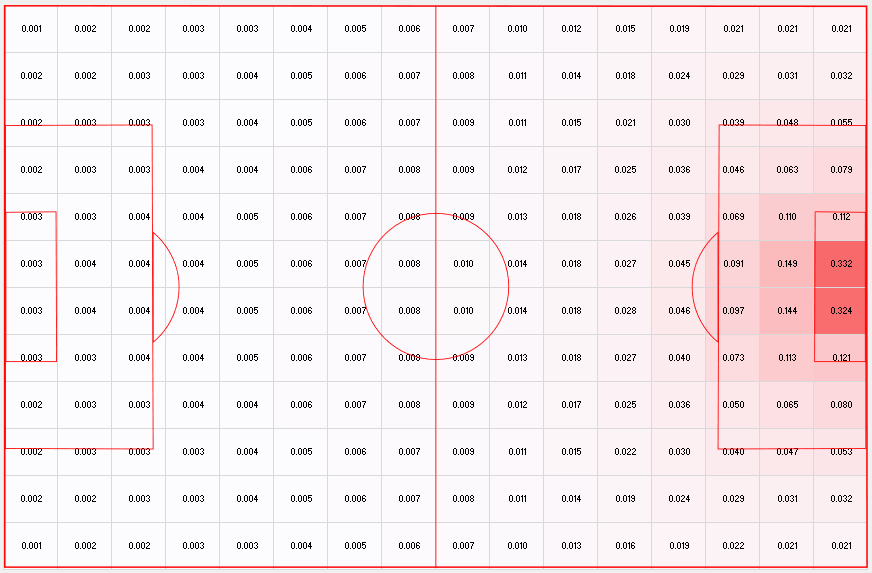
You may also notice that this uses a slightly larger zone than my GPA metric, diving the pitch into 192 zones in a 16 by 12 layout.
You’ll see this metric coming into my graphics as well.
Splitting out Shot Assisted xG (xAG) and xA
This was something that was done by FBref, that I always liked and I am adopting this to my new way of collecting data.
What this change does is treat and credit the value of a key pass differently.
Shot assisted xG, has always been a better name for what xA measures but my view on names of things don’t always win out. This is the classic way of crediting a player for a key pass, where they make a pass that leads to a shot and it is simply the expected value of that shot.
Often times this works out just fine but there are occasions where the player that receives the pass does a ton of work turning a low probability of scoring chance into a high probability of scoring chance and crediting the player making the pass would give the wrong impression.
Similarly, a player can make a great pass to set up a good shooting opportunity and for whatever reason a shot never happens, and the passer ends up with no credit whatsoever.
One of the remedies for this is to only look at where the pass was completed and credit for the probability of scoring from there. This also removes the dependency on a player needing to convert that pass into a shot.
This will be tracked with the following:
xAG - Value of the shot credited to the passer
xA - Probability of a completed pass being converted into a goal
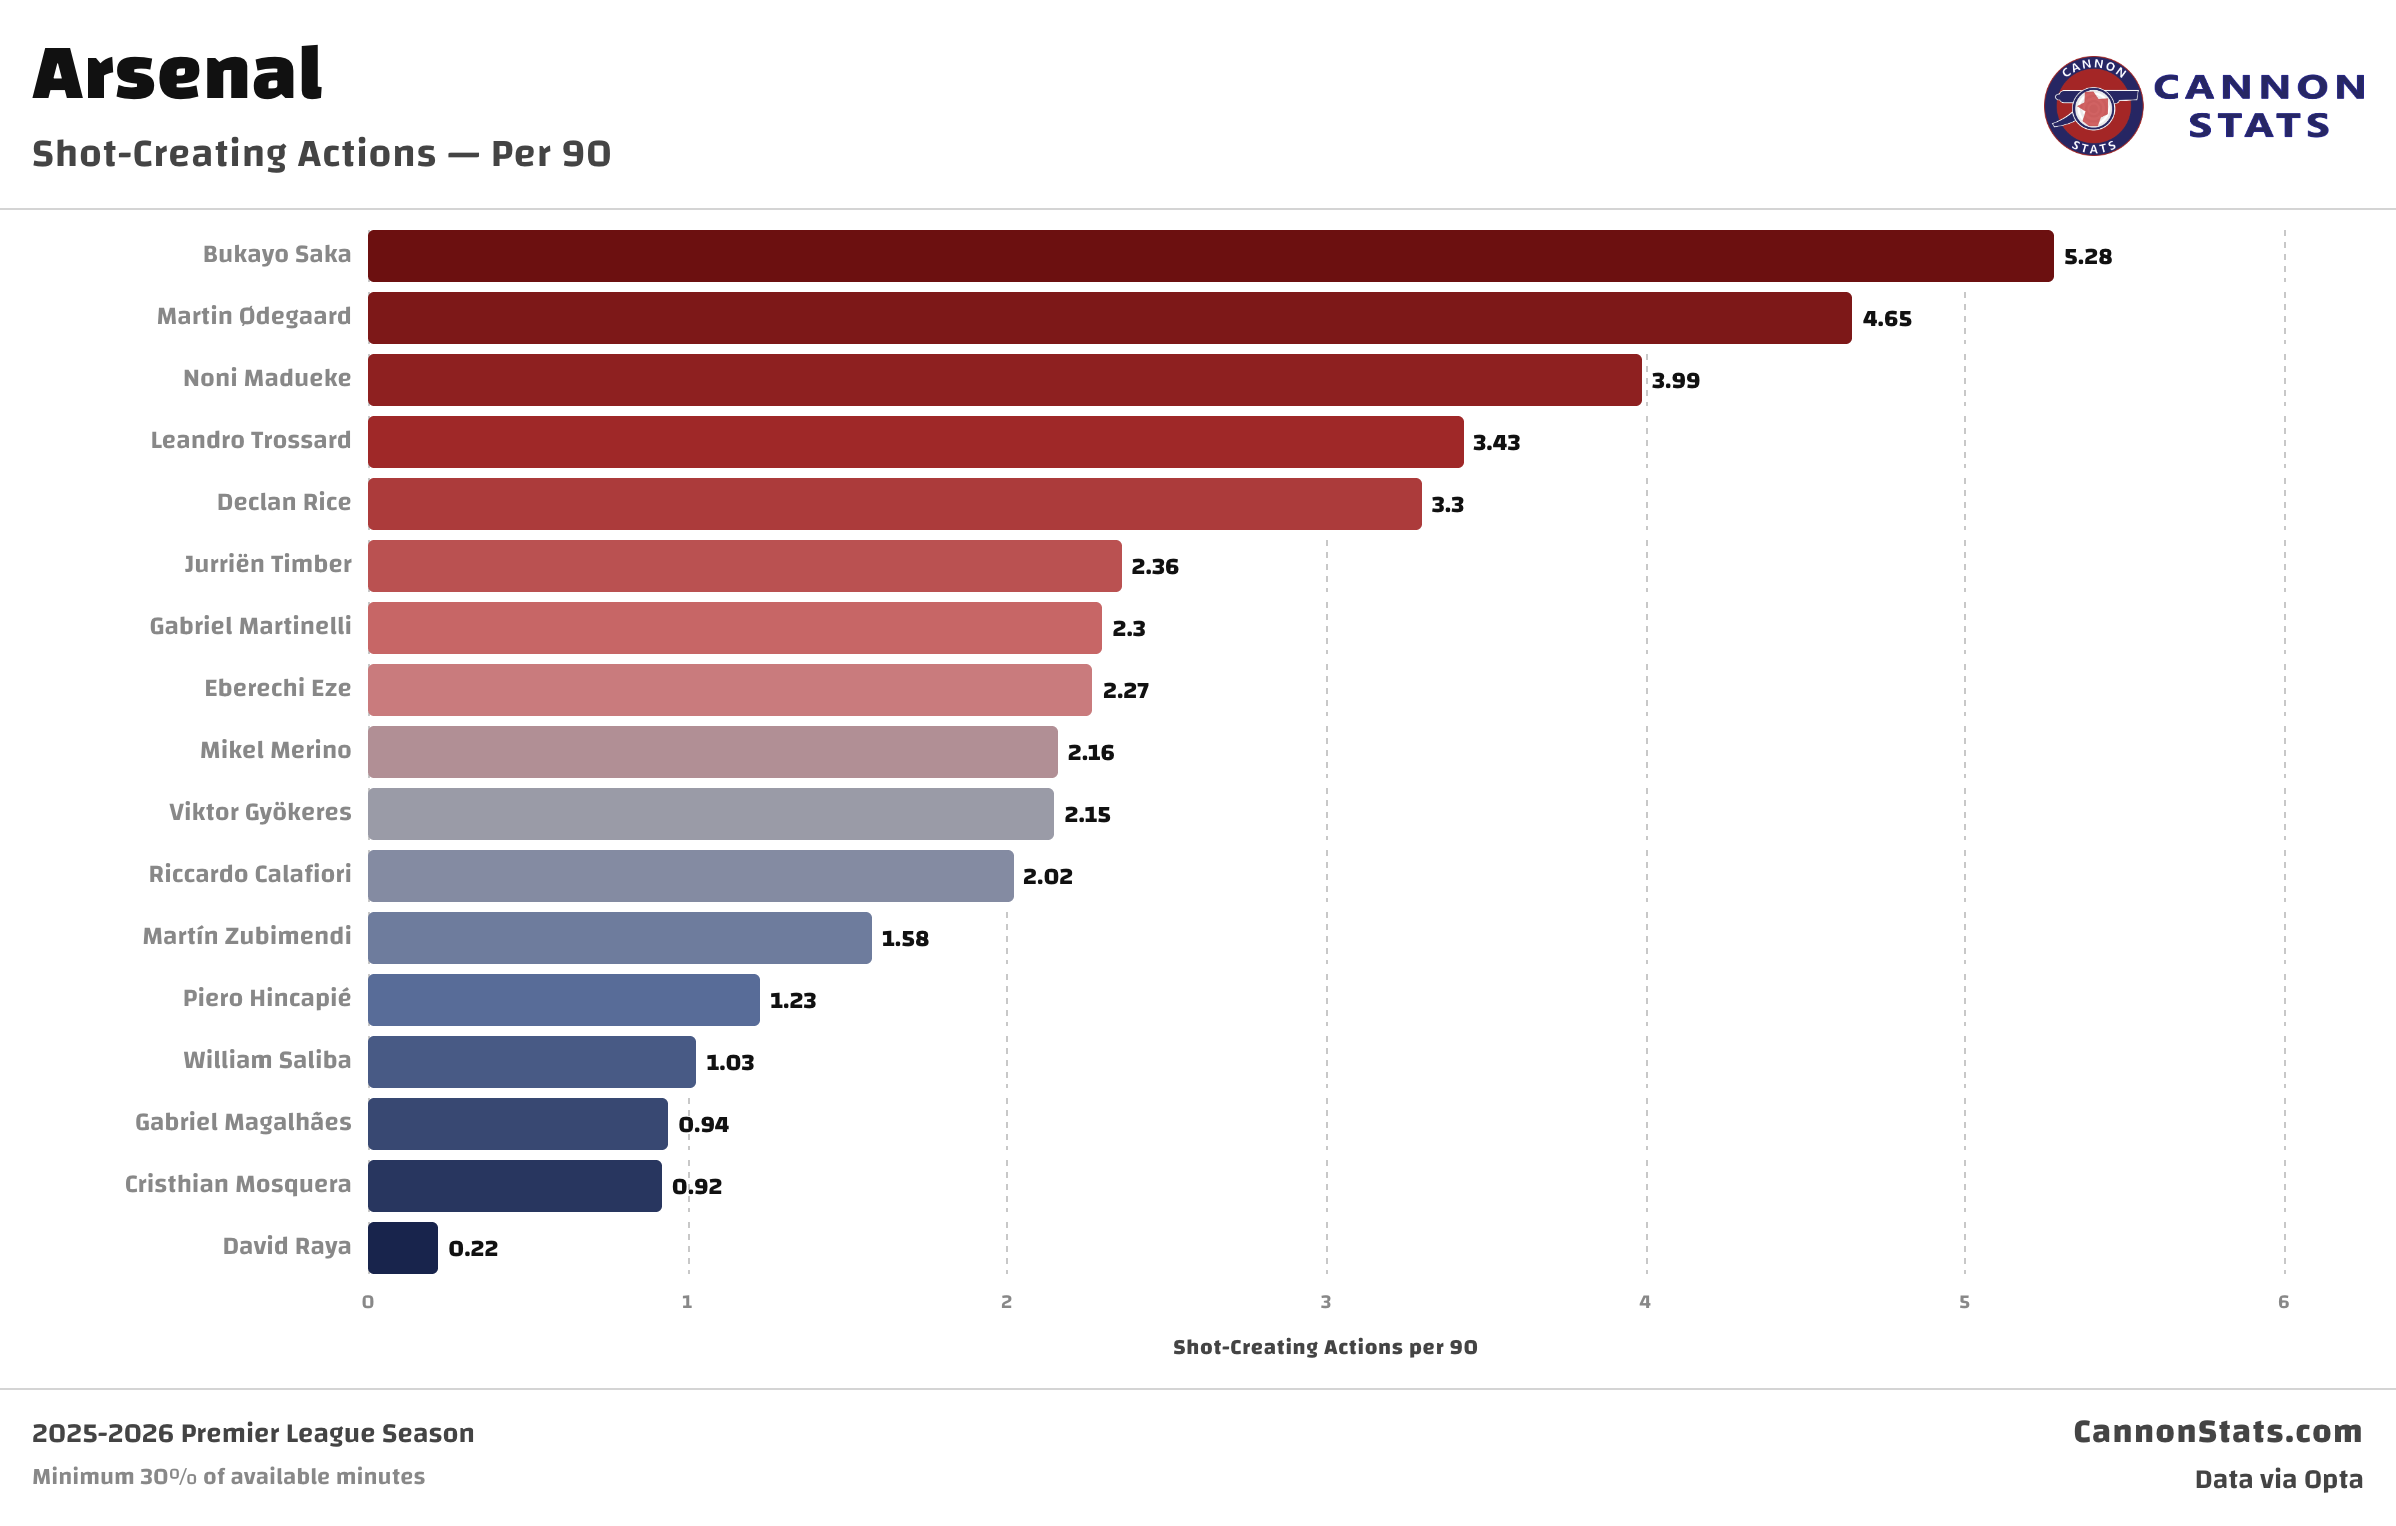
Shot Creating Actions
This is another metric that was created by FBref that I found was quite valuable and wanted to be able to look at in more detail in my own data.
A shot creating action is one of the two successful attacking actions that lead up to a shot being taken. This is an expansion on the key pass idea and includes the ability to create your own shot.
This would include live-ball passes, set-play passes, successful dribbles, shots which lead to another shot, and winning a free kick (getting fouled) or a corner.
One of the other items that I have expanded on here as well, is including the expected goal value of the shots created. Like shot assisted xG this can give credit where maybe it isn’t deserved fully but it does also differentiate that not all shots are worth the same. We are always making tradeoffs here and I think it is nice to have an idea of the value of the actions.
Here is a visual illustration and a video to drive home where the different ways that actions that lead to a shot get credit.
This is Arsenal’s 2nd goal against Bayern Munich in the 2025-26 Champions League group stage match from November 2025.
Here is how it looks in the event data. It starts with a Declan Rice ball recovery (there will be more on the different ways that recoveries, blocked passes, and interceptions work later), he carries the ball forward before he lays it off to Eberechi Eze. Eze then plays in Riccardo Calafiori making a nice underlapping run. Calafiori plays a nice out swinging left footed cross that finds Noni Madueke at the back post to finish first time to put Arsenal ahead 2-1.
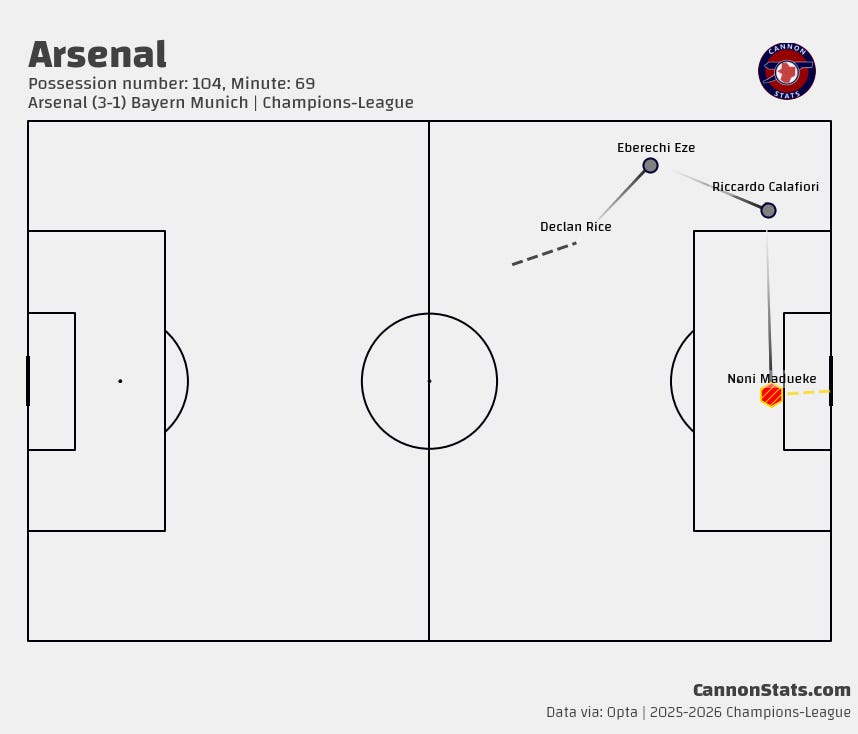
There are a number of ways that this ends up getting valued and credited to the different players let’s break it down.
We are talking about shot creating actions, and for this one we have two. The first is credited to Eze for making the pre-assist, the second goes to Calafiori for making the pass that assisted the shot. Each player would get 1 SCA, they would also have an xGCA (xG Creating Action) of 0.86 because this is a HUGE chance.
Calafiori would also get credit for 0.86, xG Assisted, with a 0.16 xA for completing a cross into this location. He would also get credit for 0.86 on xG Chain but would not get any credit for xG Buildup because he only had a hand in one of the final actions. On GPA, Calafiori gets a bunch of credit with his cross adding +12%.
Eze gets his SCA, but he also gets credit for xG Buildup and xG Chain, plus his pass here does also add in 0.01 xA. On GPA, Eze gets +1% for his pass completion to Calafiori.
Rice gets a bit of the short end of the stick here for credit. His action to intercept the ball probably does the second most to contribute to the goal, and he ends up only getting credit for xG Buildup and xG Chain with no key pass or shot creating action on the scoresheet. His pass technically gets 0.001 xA as well but that’s not going to really move the needle here. Here is where GPA helps him out, his recovery interception is worth +4% and his carry plus pass adds another +0.5%.
Madueke gets credit for the goal (obviously) but would also get the xG Chain added to his tally. On GPA, he gets credit for getting on the end of the pass worth +9% and converting this position on the field into a shot is worth +25%, the execution of the shot here actually brings it down a bit -4% but overall, he gets a ton of credit here at +30%.
Updated xPass Completion Model
My xPass metric has been helpful for me and it helped to differentiate that not all passes have the same difficulty.
This helped me to push out something like pass efficiency, trying to get an idea of a player’s passing skill by comparing the rate at which they completed passes compared to what an average player would have done.
I am not getting rid of this metric, but rather I am updating it by doing a more advanced way of estimating the probability of a pass being completed.
The previous version was zone based, looking at the starting location of the pass and how often passes from that zone to the end zone were completed. This works quite well but I think it is possible to do better than this.
For the new metric I have switched to eXtreme Gradient Boosting model that takes the different features to predict if a pass will be completed or not. It is actually two models and I take the average of the two, because I was a bit worried about over fitting including the distance metric
The features that I have chosen fall into a few different categories.
Descriptions of where on the field that the pass happens and where it is being aimed:
pass start distance from center
pass start distance from end line
pass start distance to goal
pass angle
The model that includes pass distance also includes these:
progressive distance (measured from the center of the goal that the team is attacking)
pass lateral distance
pass horizontal distance
pass end distance from center
pass end distance from end line
The situation for the pass:
regular play pass
kick off
goal kick
free kick
corner kick
direct speed of play in the sequence
the closest the team has been to goal in the last 5 actions
Descriptions for how the pass was played
pass from feet on the ground
pass from feet chipped into the air
headed pass
a contested pass from an aerial duel
a through ball, cross, switch, layoff, pullback, flicked on
Game state for the pass
Score difference
Player advantage/disadvantage
Minute played
Updated xG model
This is one of the items that I was most excited about, and it was something that I had wanted to do for a long time.
My old model has served me well but my skills and the tools that I have available now have opened up the opportunity to improve upon it. One of the big additions that I was able to do was also switch to an event dataset that includes more robust information that I didn’t have previously. The major addition here is the coordinates of the keeper when the shot is taken, plus a measure for pressure that the shooter is under and the overall clarity towards goal.
Knowing when there is an open goal to aim at is a pretty big deal and that is one of the areas where because my model didn’t have that input, it would infer that from other information and that generally worked well in the aggregate, but it could really mess up individual chances.
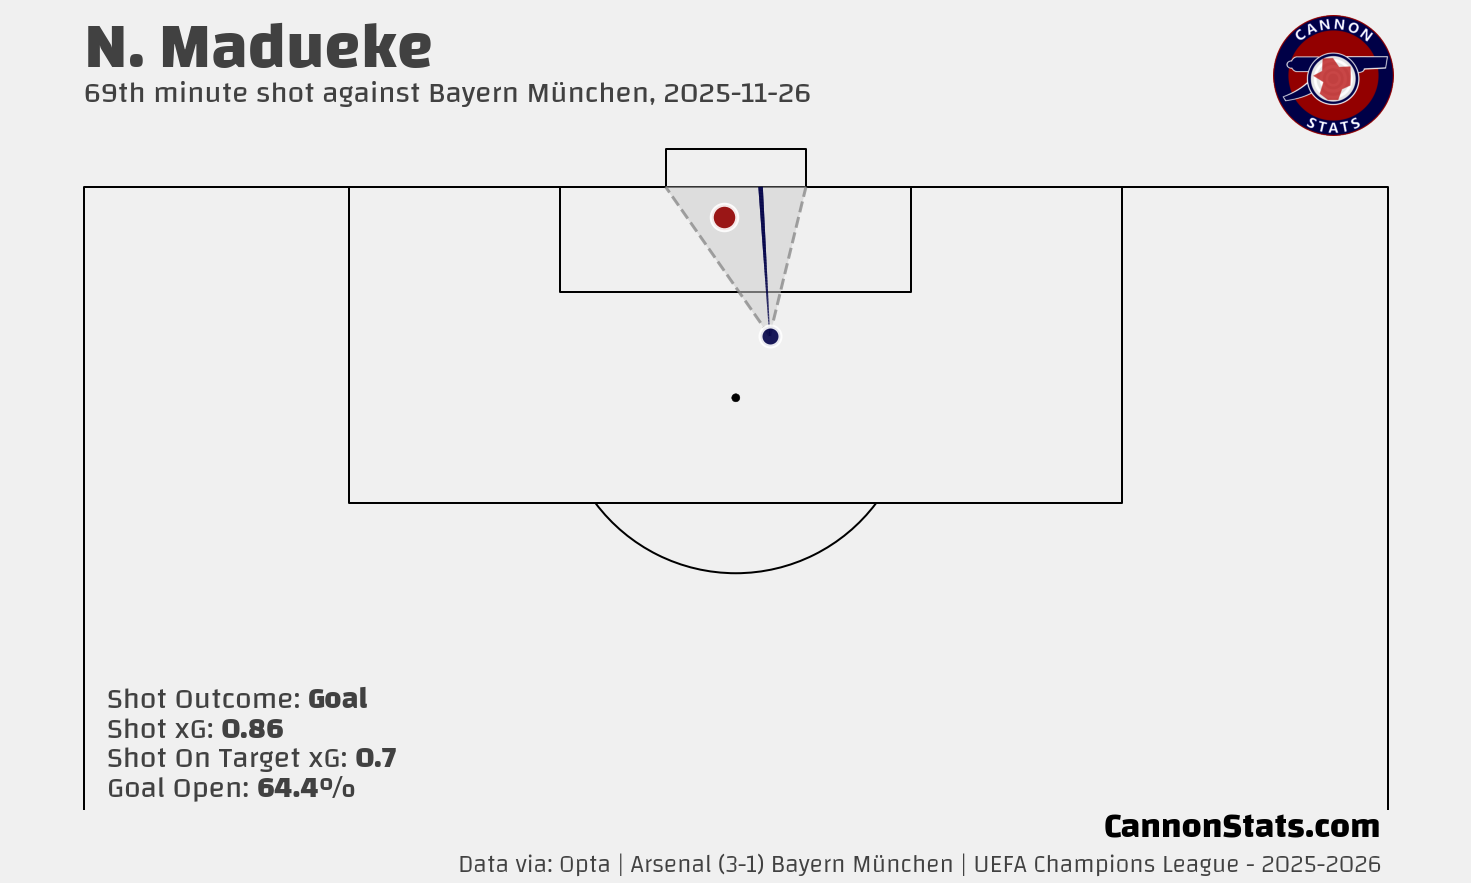
This is a pretty big one and should help make the overall values more accurate.
I am continuing to add more and more but I wanted to give some updates on where things are going.