

It’s not even the end of July and we have already seen the British transfer record broken twice. First it was Elliot Anderson going for £116m to Manchester City, now it is Morgan Rogers going for £117m to Chelsea. On top of that we have Spurs spending over £90m on Sandro Tonali rising to potentially £100m if the bonuses are hit, and £85m Mateus Fernandes.
Transfer fees taking a big jump isn’t unprecedented. Historically when we see these jumps it has come with an obvious revenue increase, most often the start of the new TV broadcast cycle. This summer is different, the Premier League had the start of their new TV deal last season and the gains in year two of a deal have not typically been as large.
If TV money were the story, the jump should have come and gone with the 2025 window. Instead we are watching an even bigger one in year two of the cycle. So what is going on? Are the new financial rules less binding and restrictive than I thought? Am I just missing something?
I decided to stop being confused and actually measure it. Back in 2019 I wrote a piece calculating historical transfer inflation with a fairly simple method. This is the long overdue update, with better data and some additional methods to make measurements.
Measuring inflation
For this I am going to present a few different approaches to measuring inflation over time.
Basket indexes: this uses different tiers of fees as the comparison for season to season. The primary basket is the 10th through the 100th largest transfer fees, with this you are cutting out some of the low priced punts and free transfers but making sure to always include the elite players. I have also added a “mid-market” that is 20-80th percentiles, and a “core” view that is 30-70th percentiles.
Hedonic Index: this includes a regression of the fees paid to try to account for differences in players that move from season to season, it includes age, position, and league to add a bit more control for variations that occur. For this I have also looked at the median level and what the most expensive transfers have looked like at the 90th percentile level.
I also have included some ratios here for the tracking of spending compared to the “market value” which comes from the estimate on transfermarkt, this should help us see if teams are paying a premium to the public consensus of perceived quality. Last is a revenue-normalized index, this attempts to measure transfer spending compared to broadcast income. This tests whether spending is growing faster than the primary revenue source for clubs.
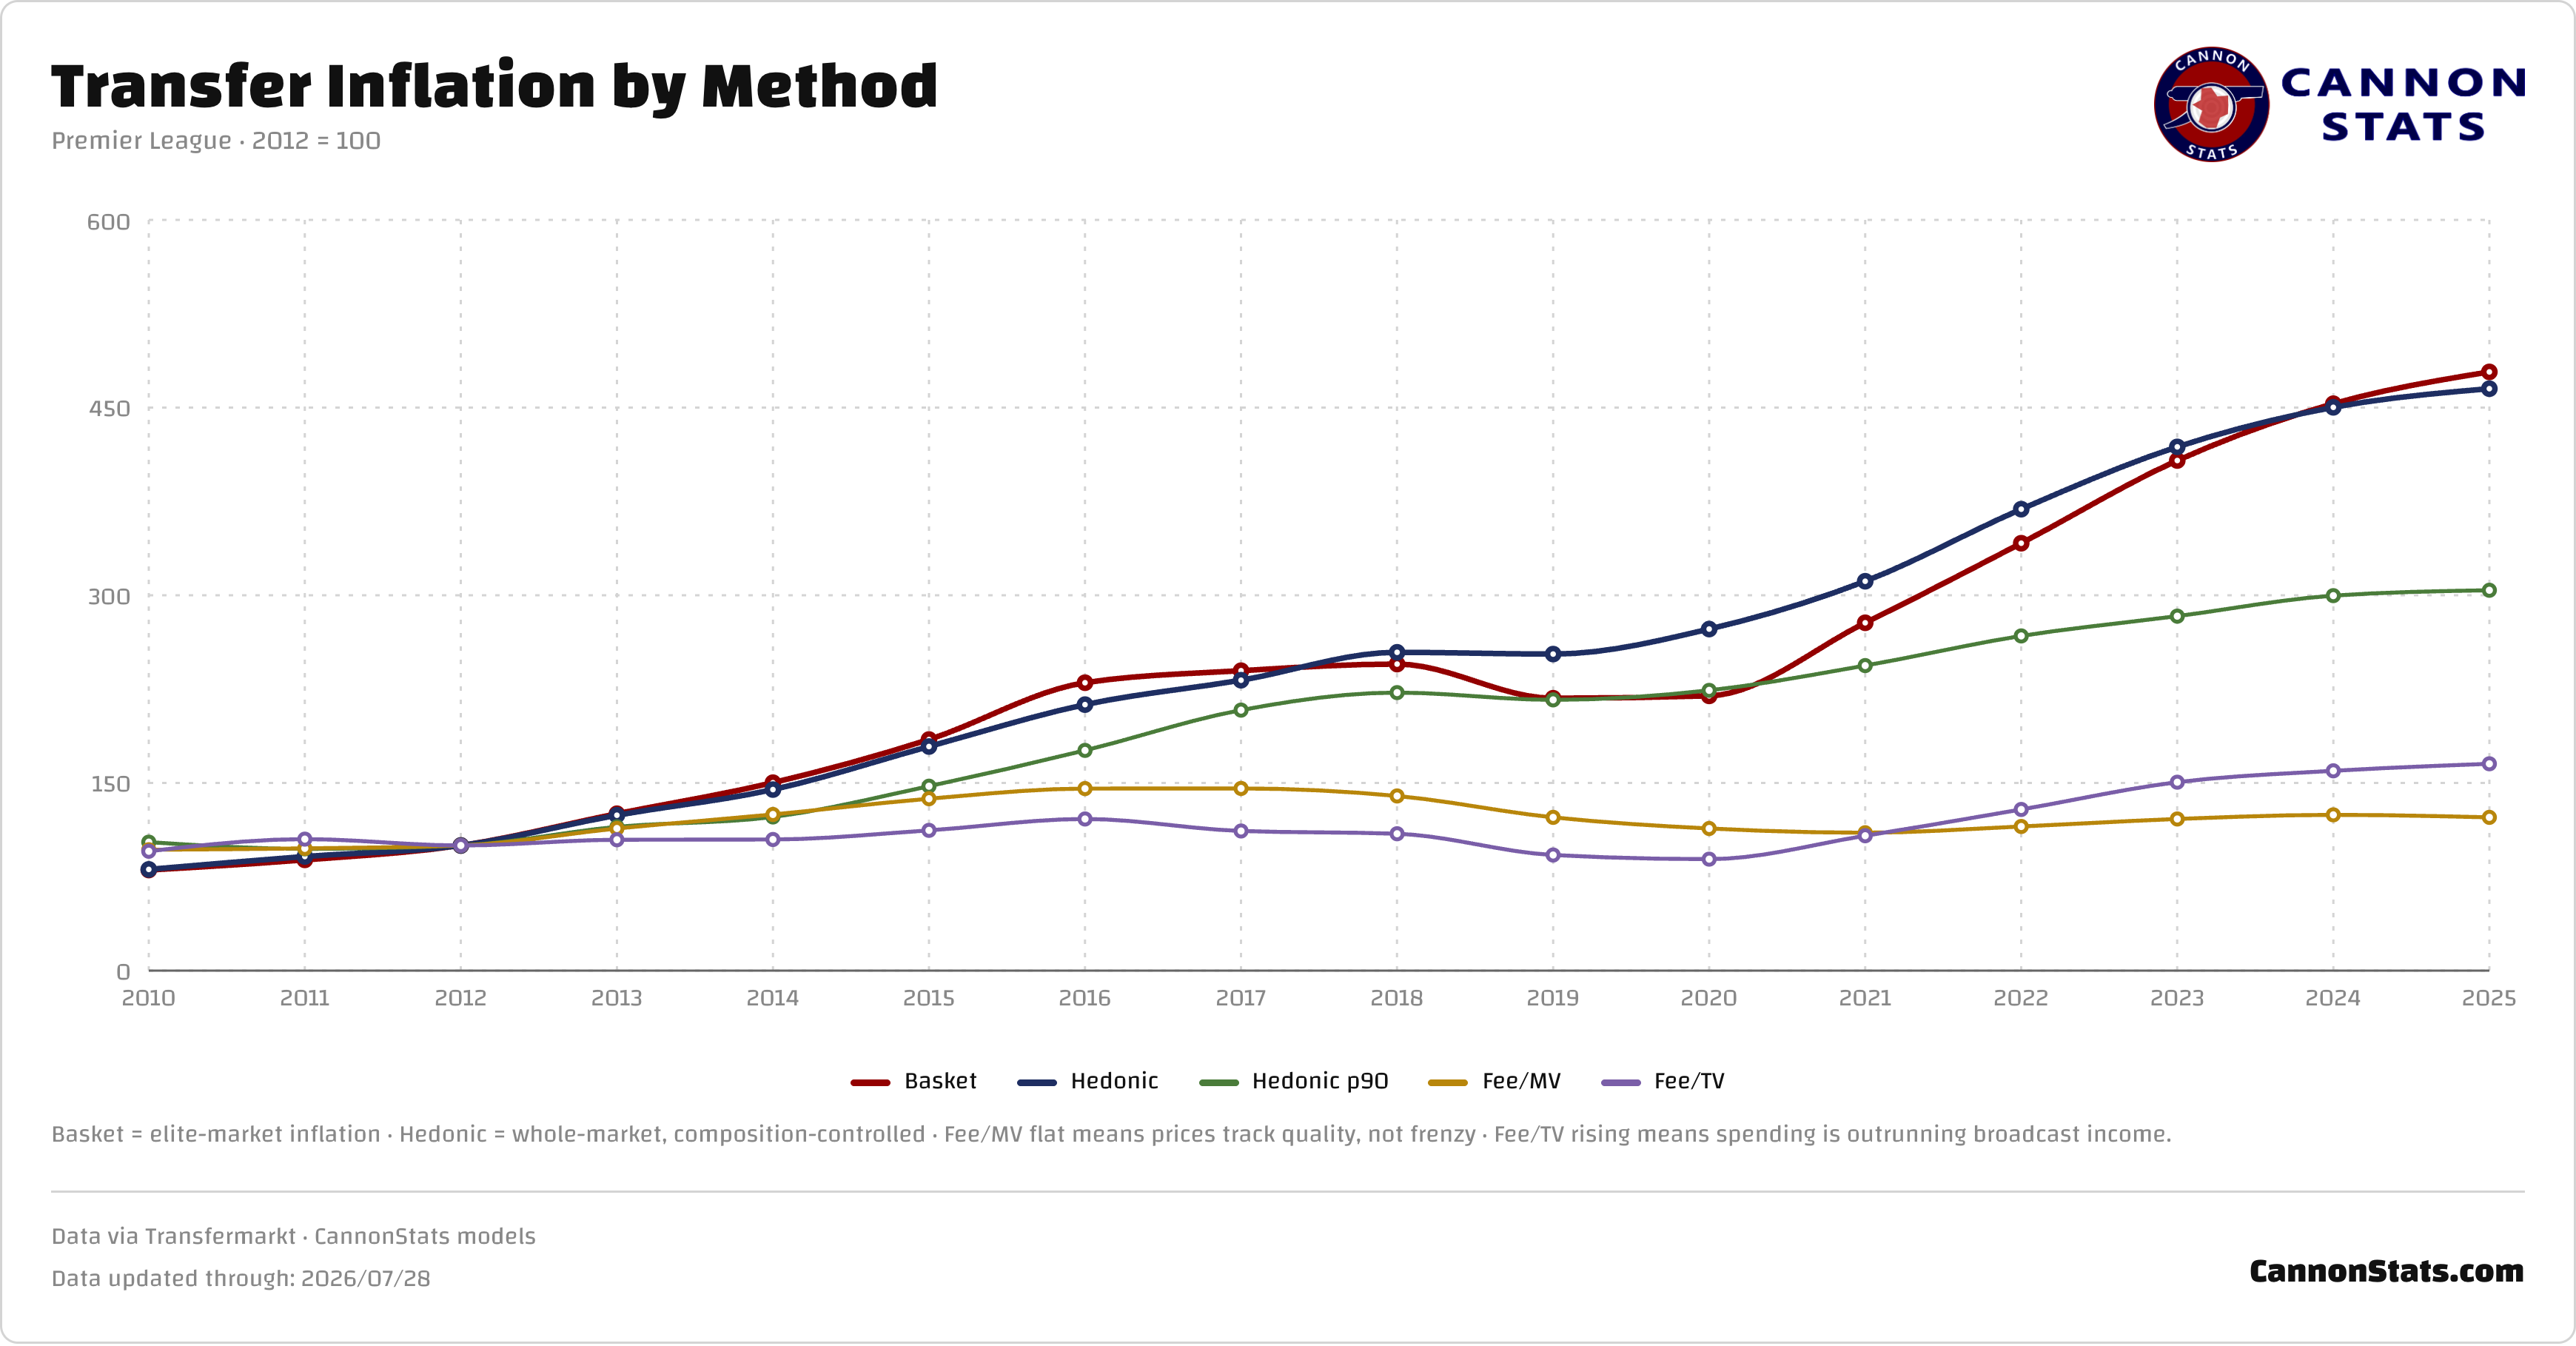
Premier League transfer fees have nearly 5xed since 2012. The basket measure of inflation shows fees up 4.8x and the hedonic measure has it at 4.7x. Surprisingly, the biggest fees haven’t seen nearly that same level of inflation, the 90th percentile fees are up only 3x since 2012, but maybe that will change after the big fees coming this summer.
When I wrote my 2019 article, the big transfer inflation looked like it might be finished: the huge influx of money from the 2013-2016 TV deal had run its course, and the next broadcast deal had modest gains, leading me to forecast that inflation should be more subdued over the following three years. For a while that looked pretty smart. Fee inflation stalled through 2019, and COVID actually saw decreases in the market.
What is interesting to me is that the total transfer spending is starting to really diverge from the TV broadcast revenues and this is something that I didn’t expect. From 2010 through 2021, transfer fees relative to the total broadcast money coming in stayed in a pretty consistent band between 0.9 and 1.2, over the last few summers it has climbed to 1.5, 1.6, and 1.7 as of last summer.
The Premier League had started to pull away on the total amount that they could spend starting in the early 2010s but the rate of change wasn’t really all that different from the other leagues. COVID really was a major pivot point and using the last summer before as the baseline point really illustrates the divergence.
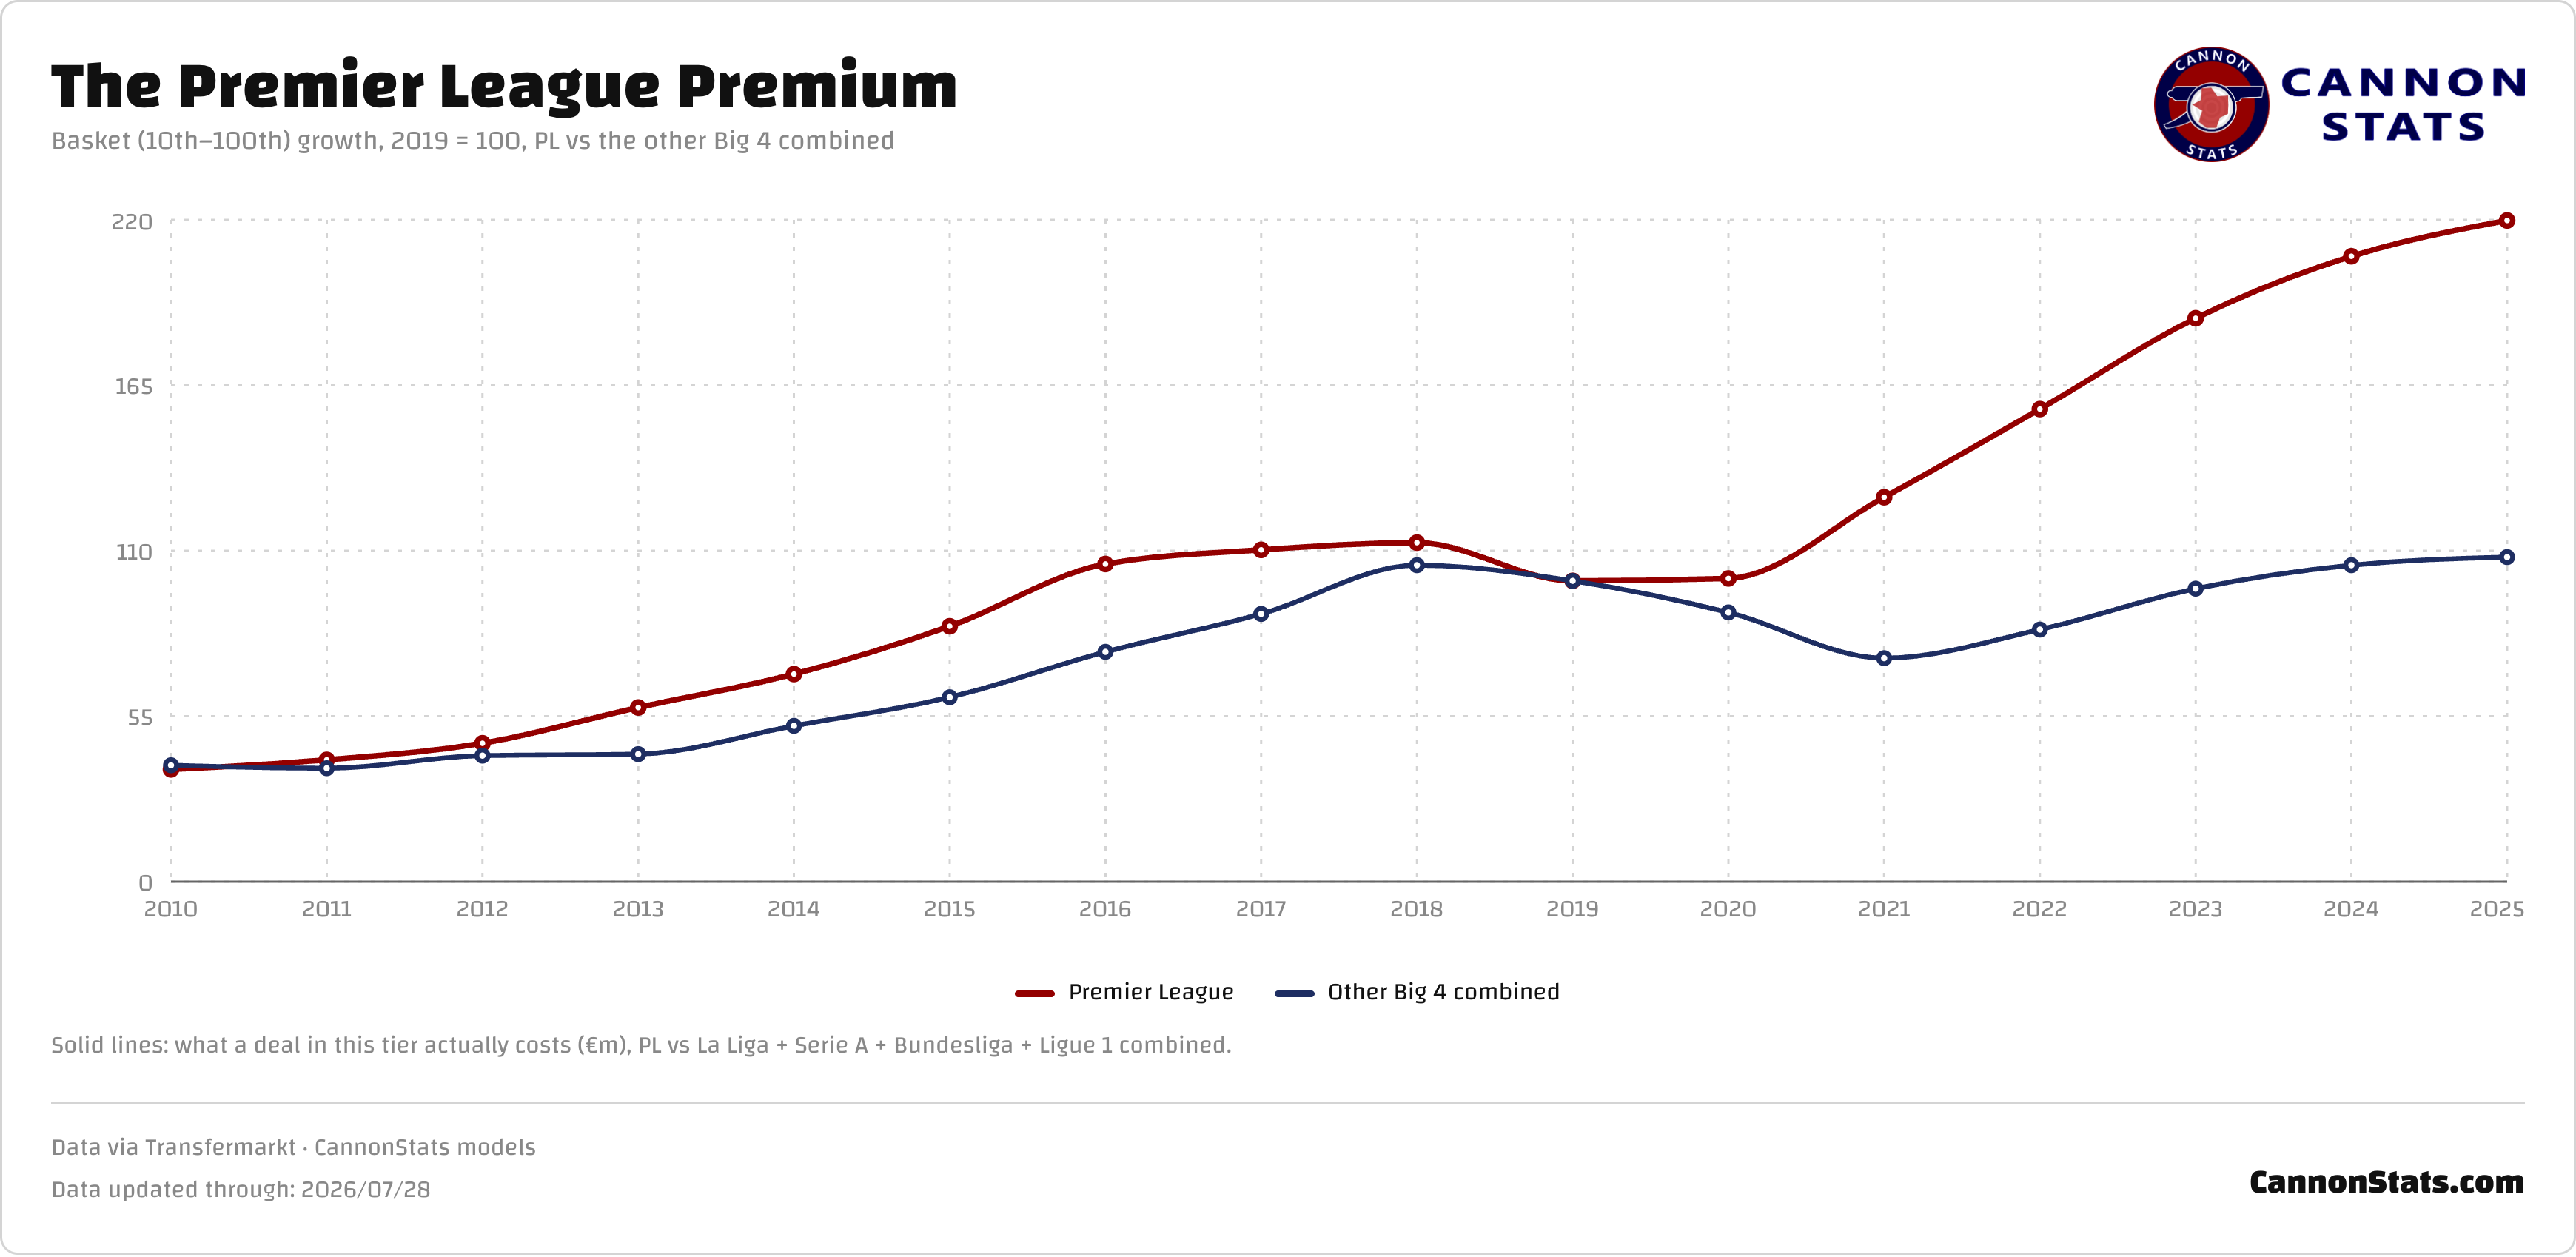
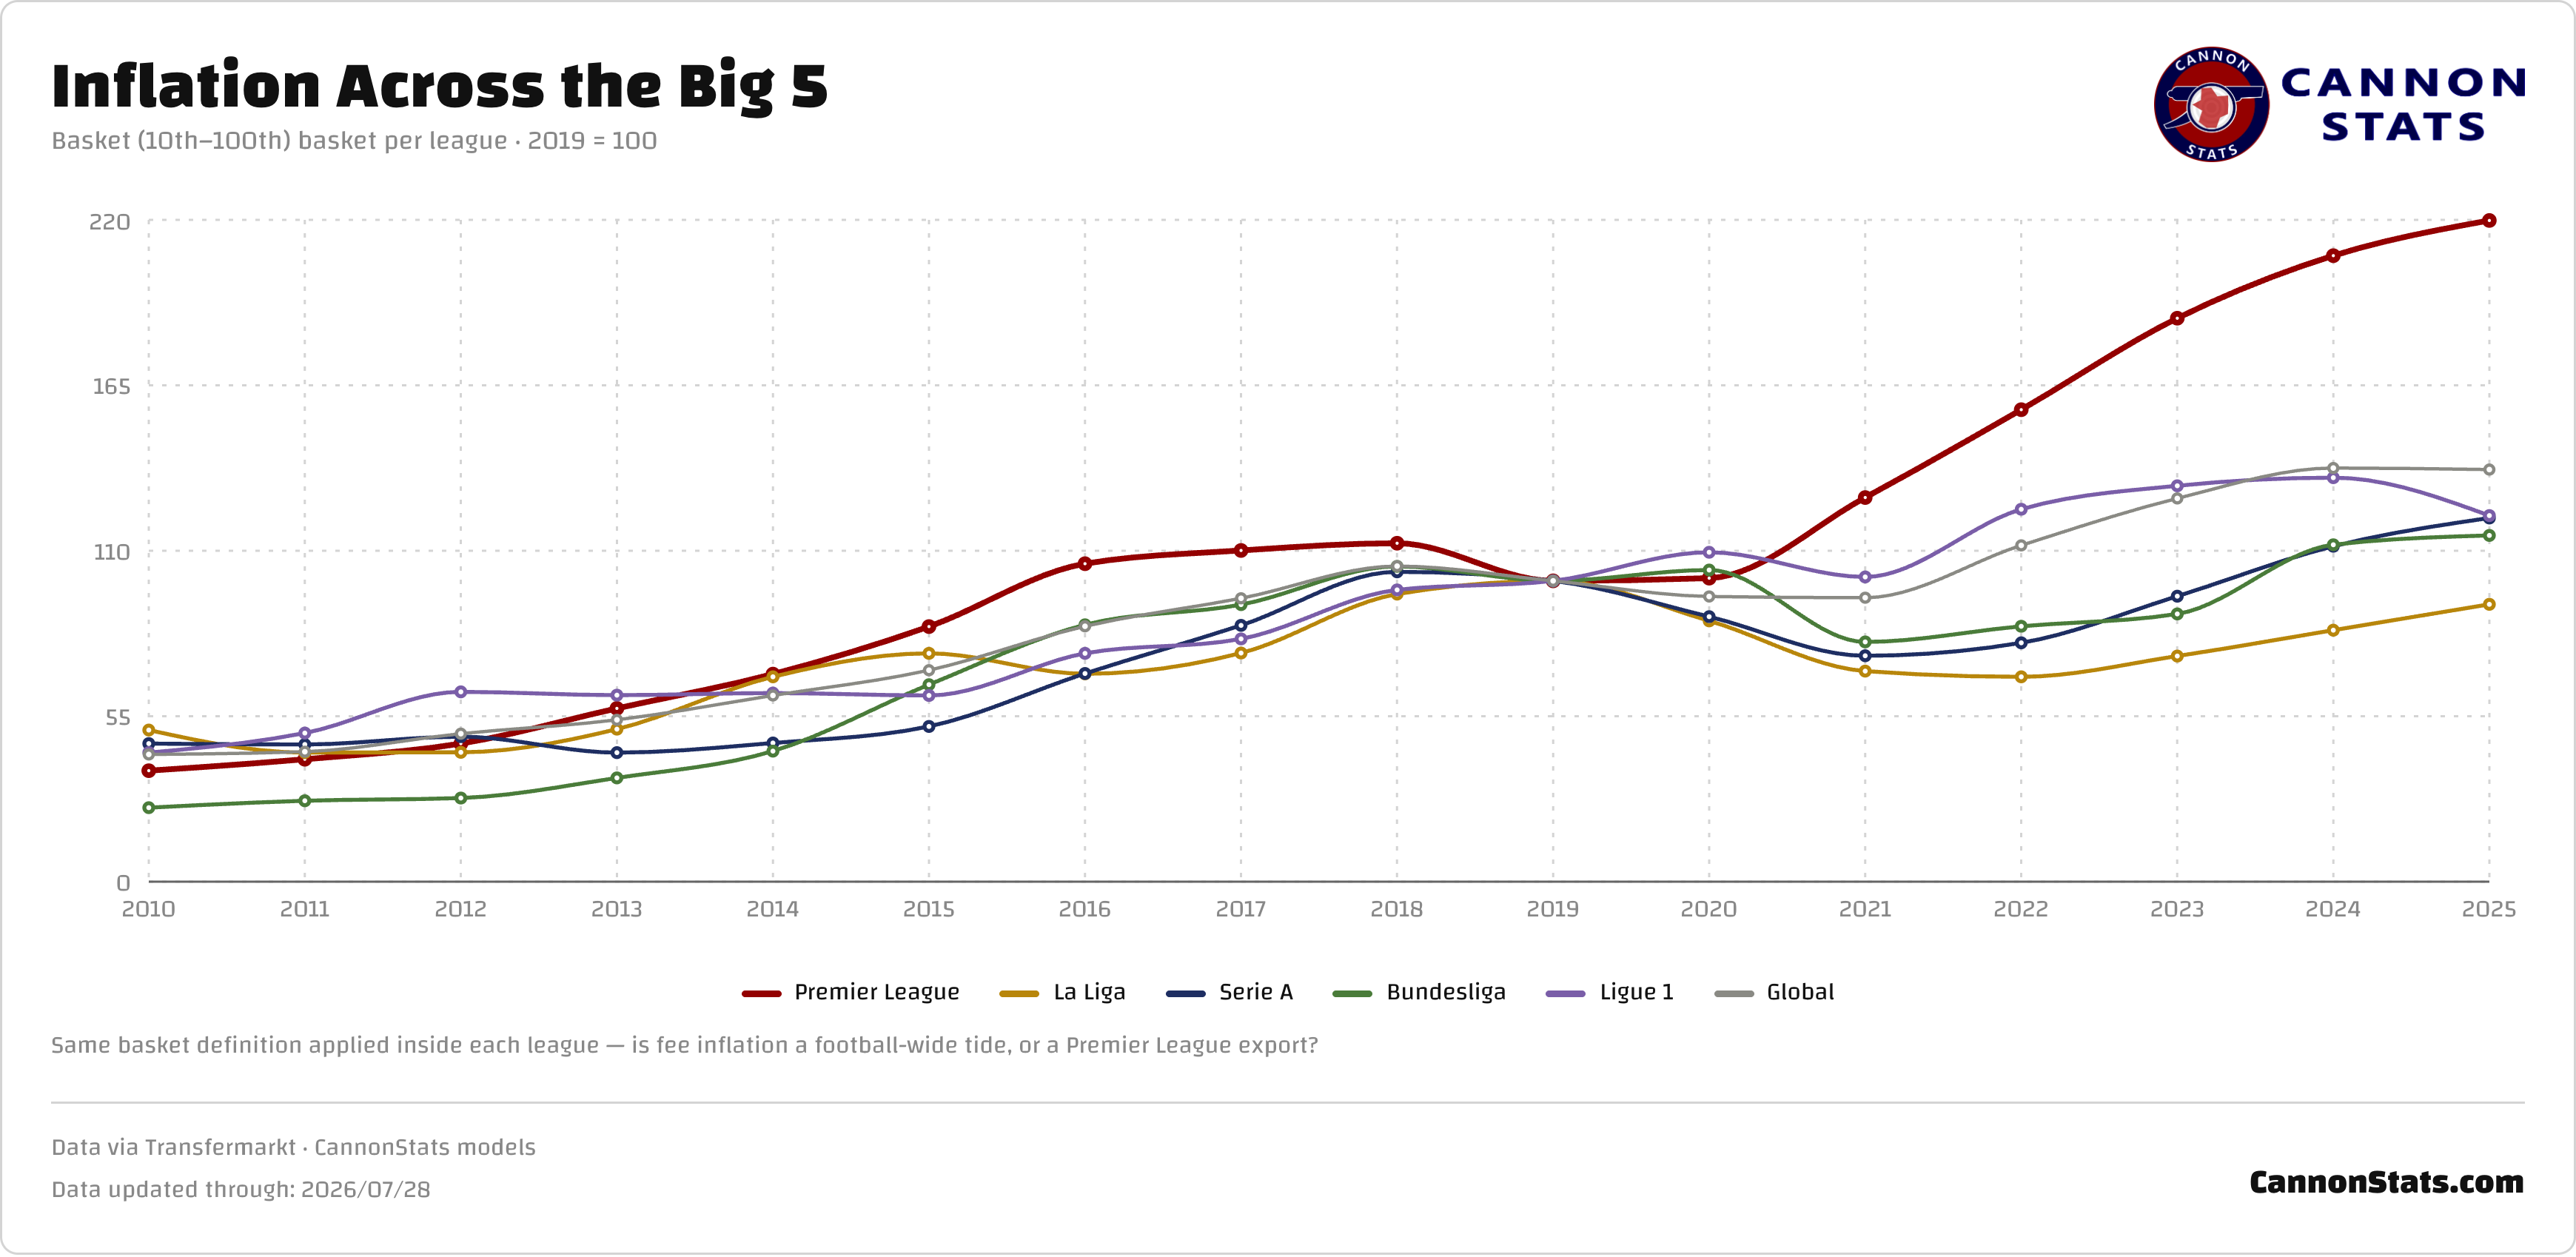
For the rest of the big 5 as a whole, it took until the summer of 2024 to get back to the 2019 level and only last summer did fees finally push past the 2019 baseline (La Liga still hasen't fully returned to 2019 levels). That is quite different from the Premier League where fees have doubled already since then.
What’s driven the recent inflation
Typically in the past the main driver of transfer inflation is the agreement of a new TV deal that brought an influx of new cash into the game. When you trace this back further, this has largely held with some blips driven by the abnormally large owner-injected spending by early Chelsea and Manchester City.
The last couple of cycles for the Premier League haven’t seen the same major boosts from the TV deals and the last deal was close to flat on the domestic side, with the major growth coming from the international rights. The jump in 2013 was 70%, 2016 was 50%, 2019 was just 15% and the 2022 deal was just under 10%. This showed in the overall transfer inflation not growing at the same rate as it had before with the big increases in TV deals.
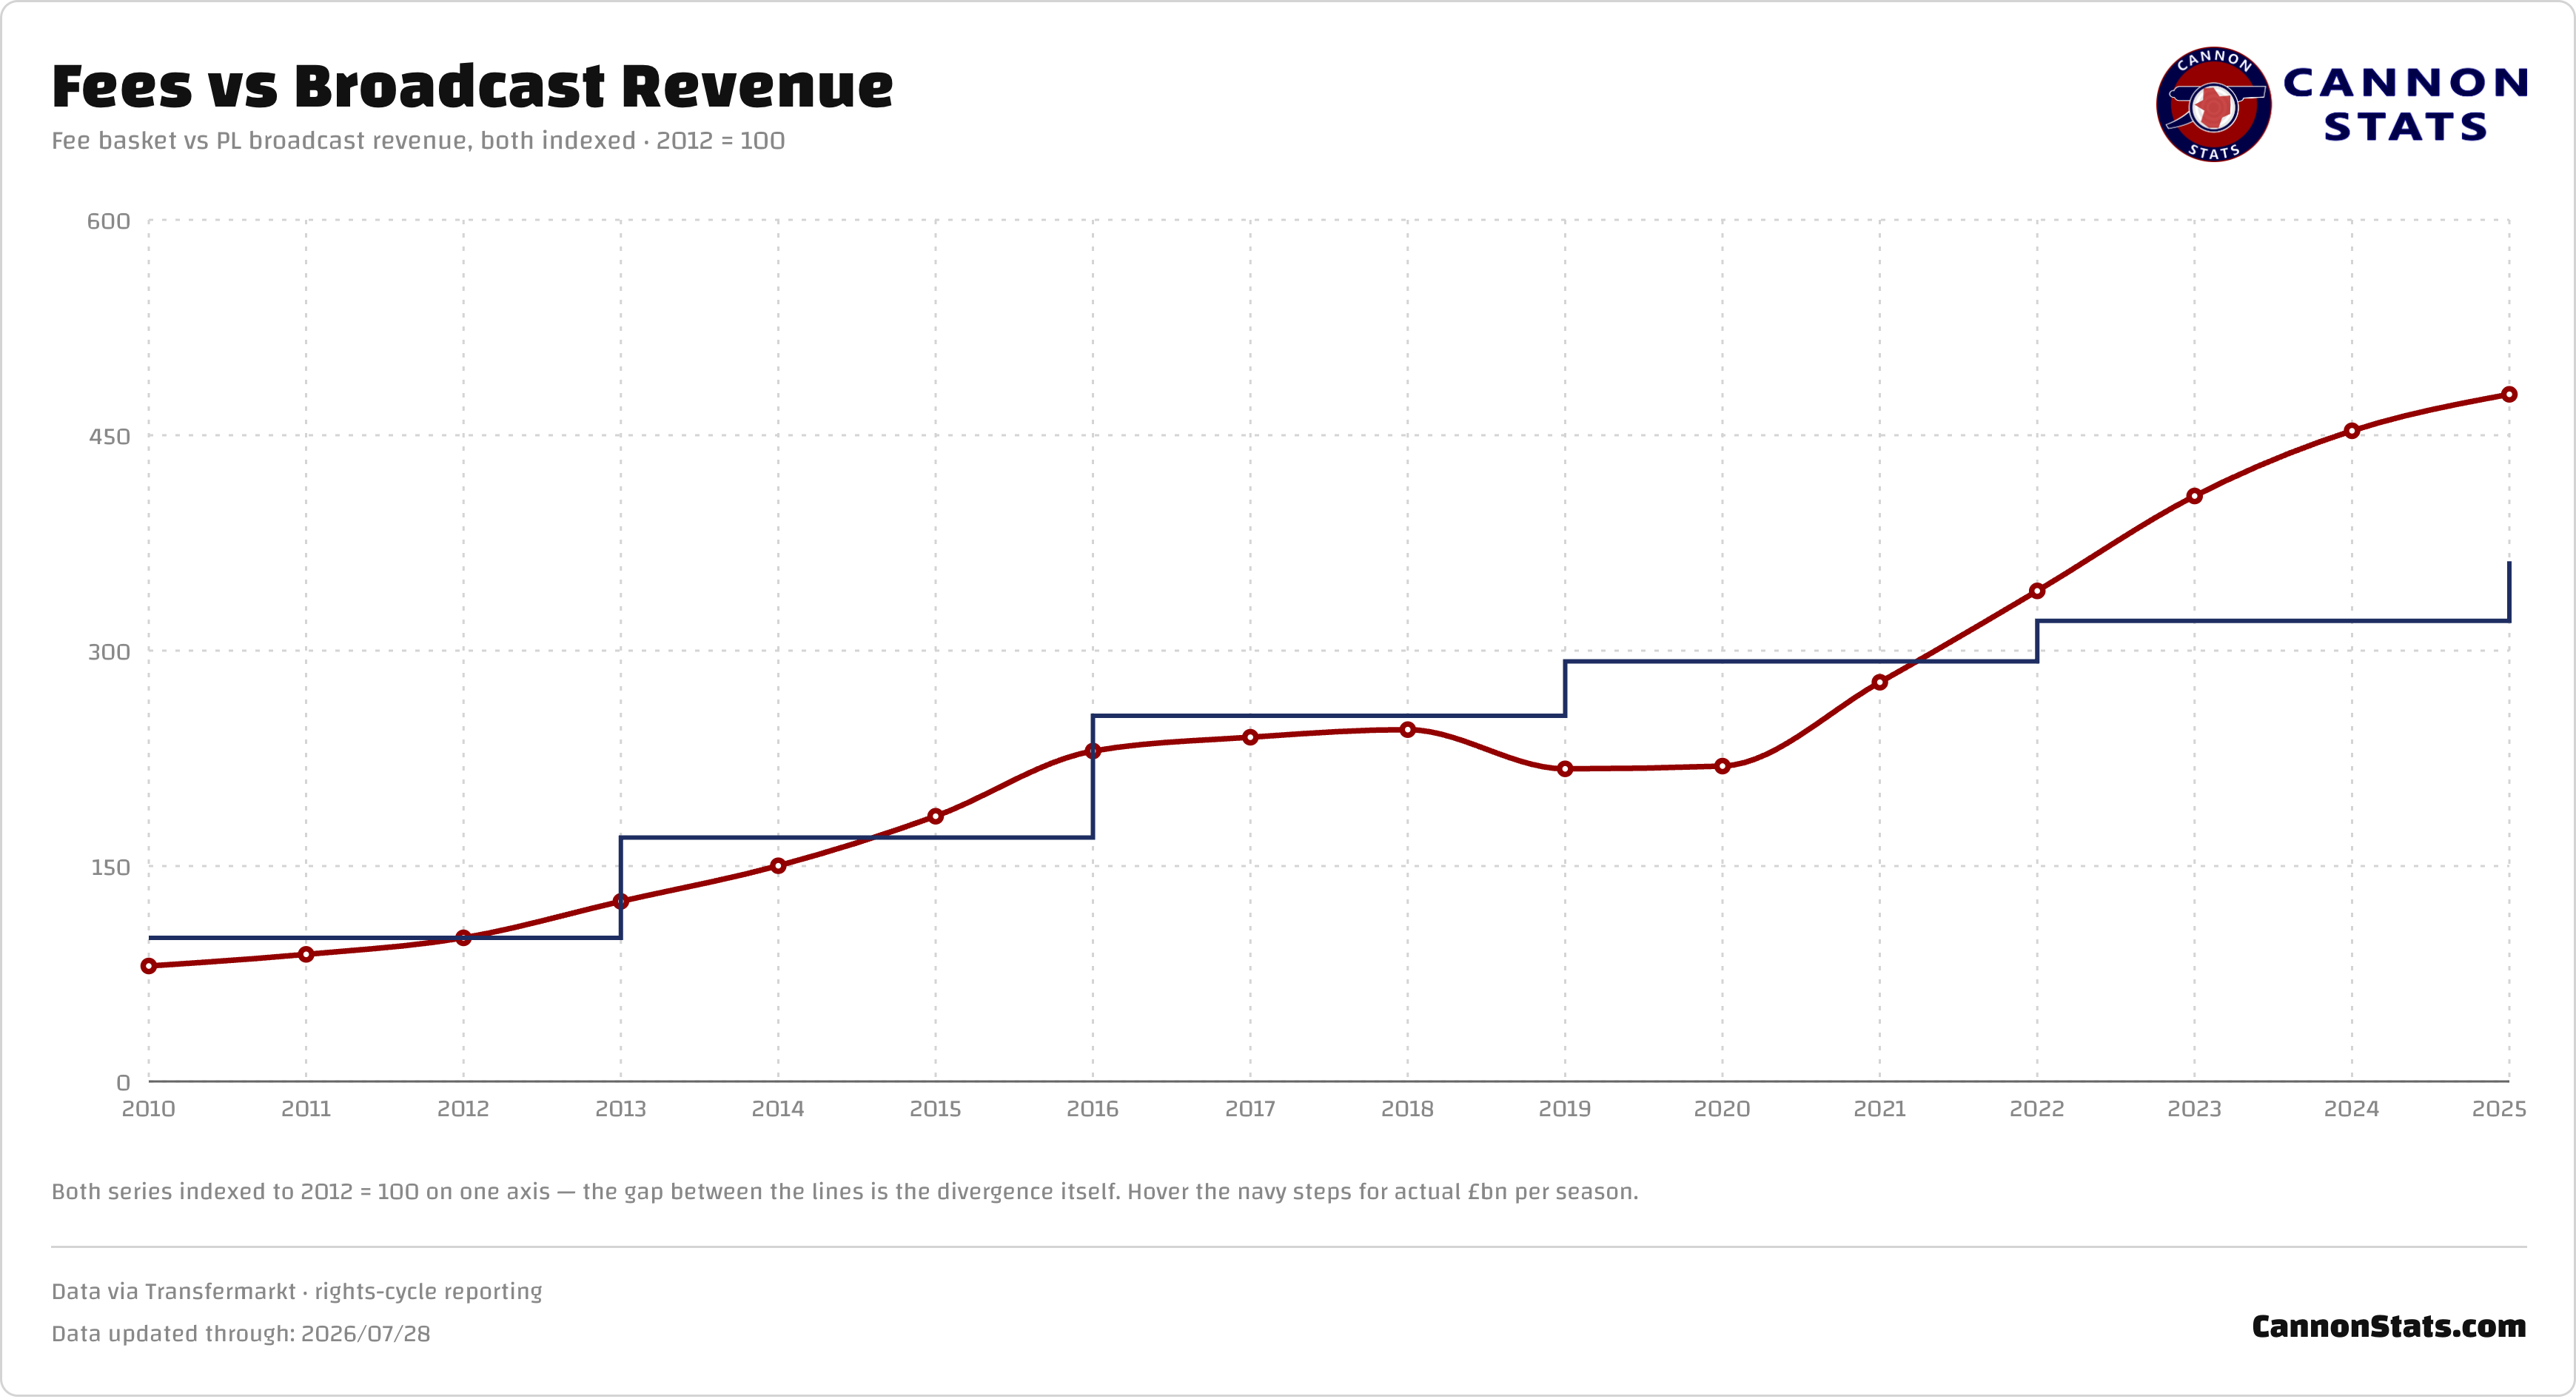
Coming out of COVID the rate of increase picked back up, catching up to the growth in the previous TV deals but it also hasn’t really slowed down at all and has really decoupled from the broadcast money.
What has surprised me is that last summer in the first year of the new TV deal there wasn’t a huge jump in year over year inflation. Transfer fees were up 5.6% (which is actually a bit lower than previous growth) and that was on the back of the extra £400m per season total, up about 13% from the season prior.
We are only halfway through the current summer of spending and it looks like rather than the pattern repeating, a fairly large increase in season one, followed by a plateau and more modest increases, teams are accelerating spending in year two.
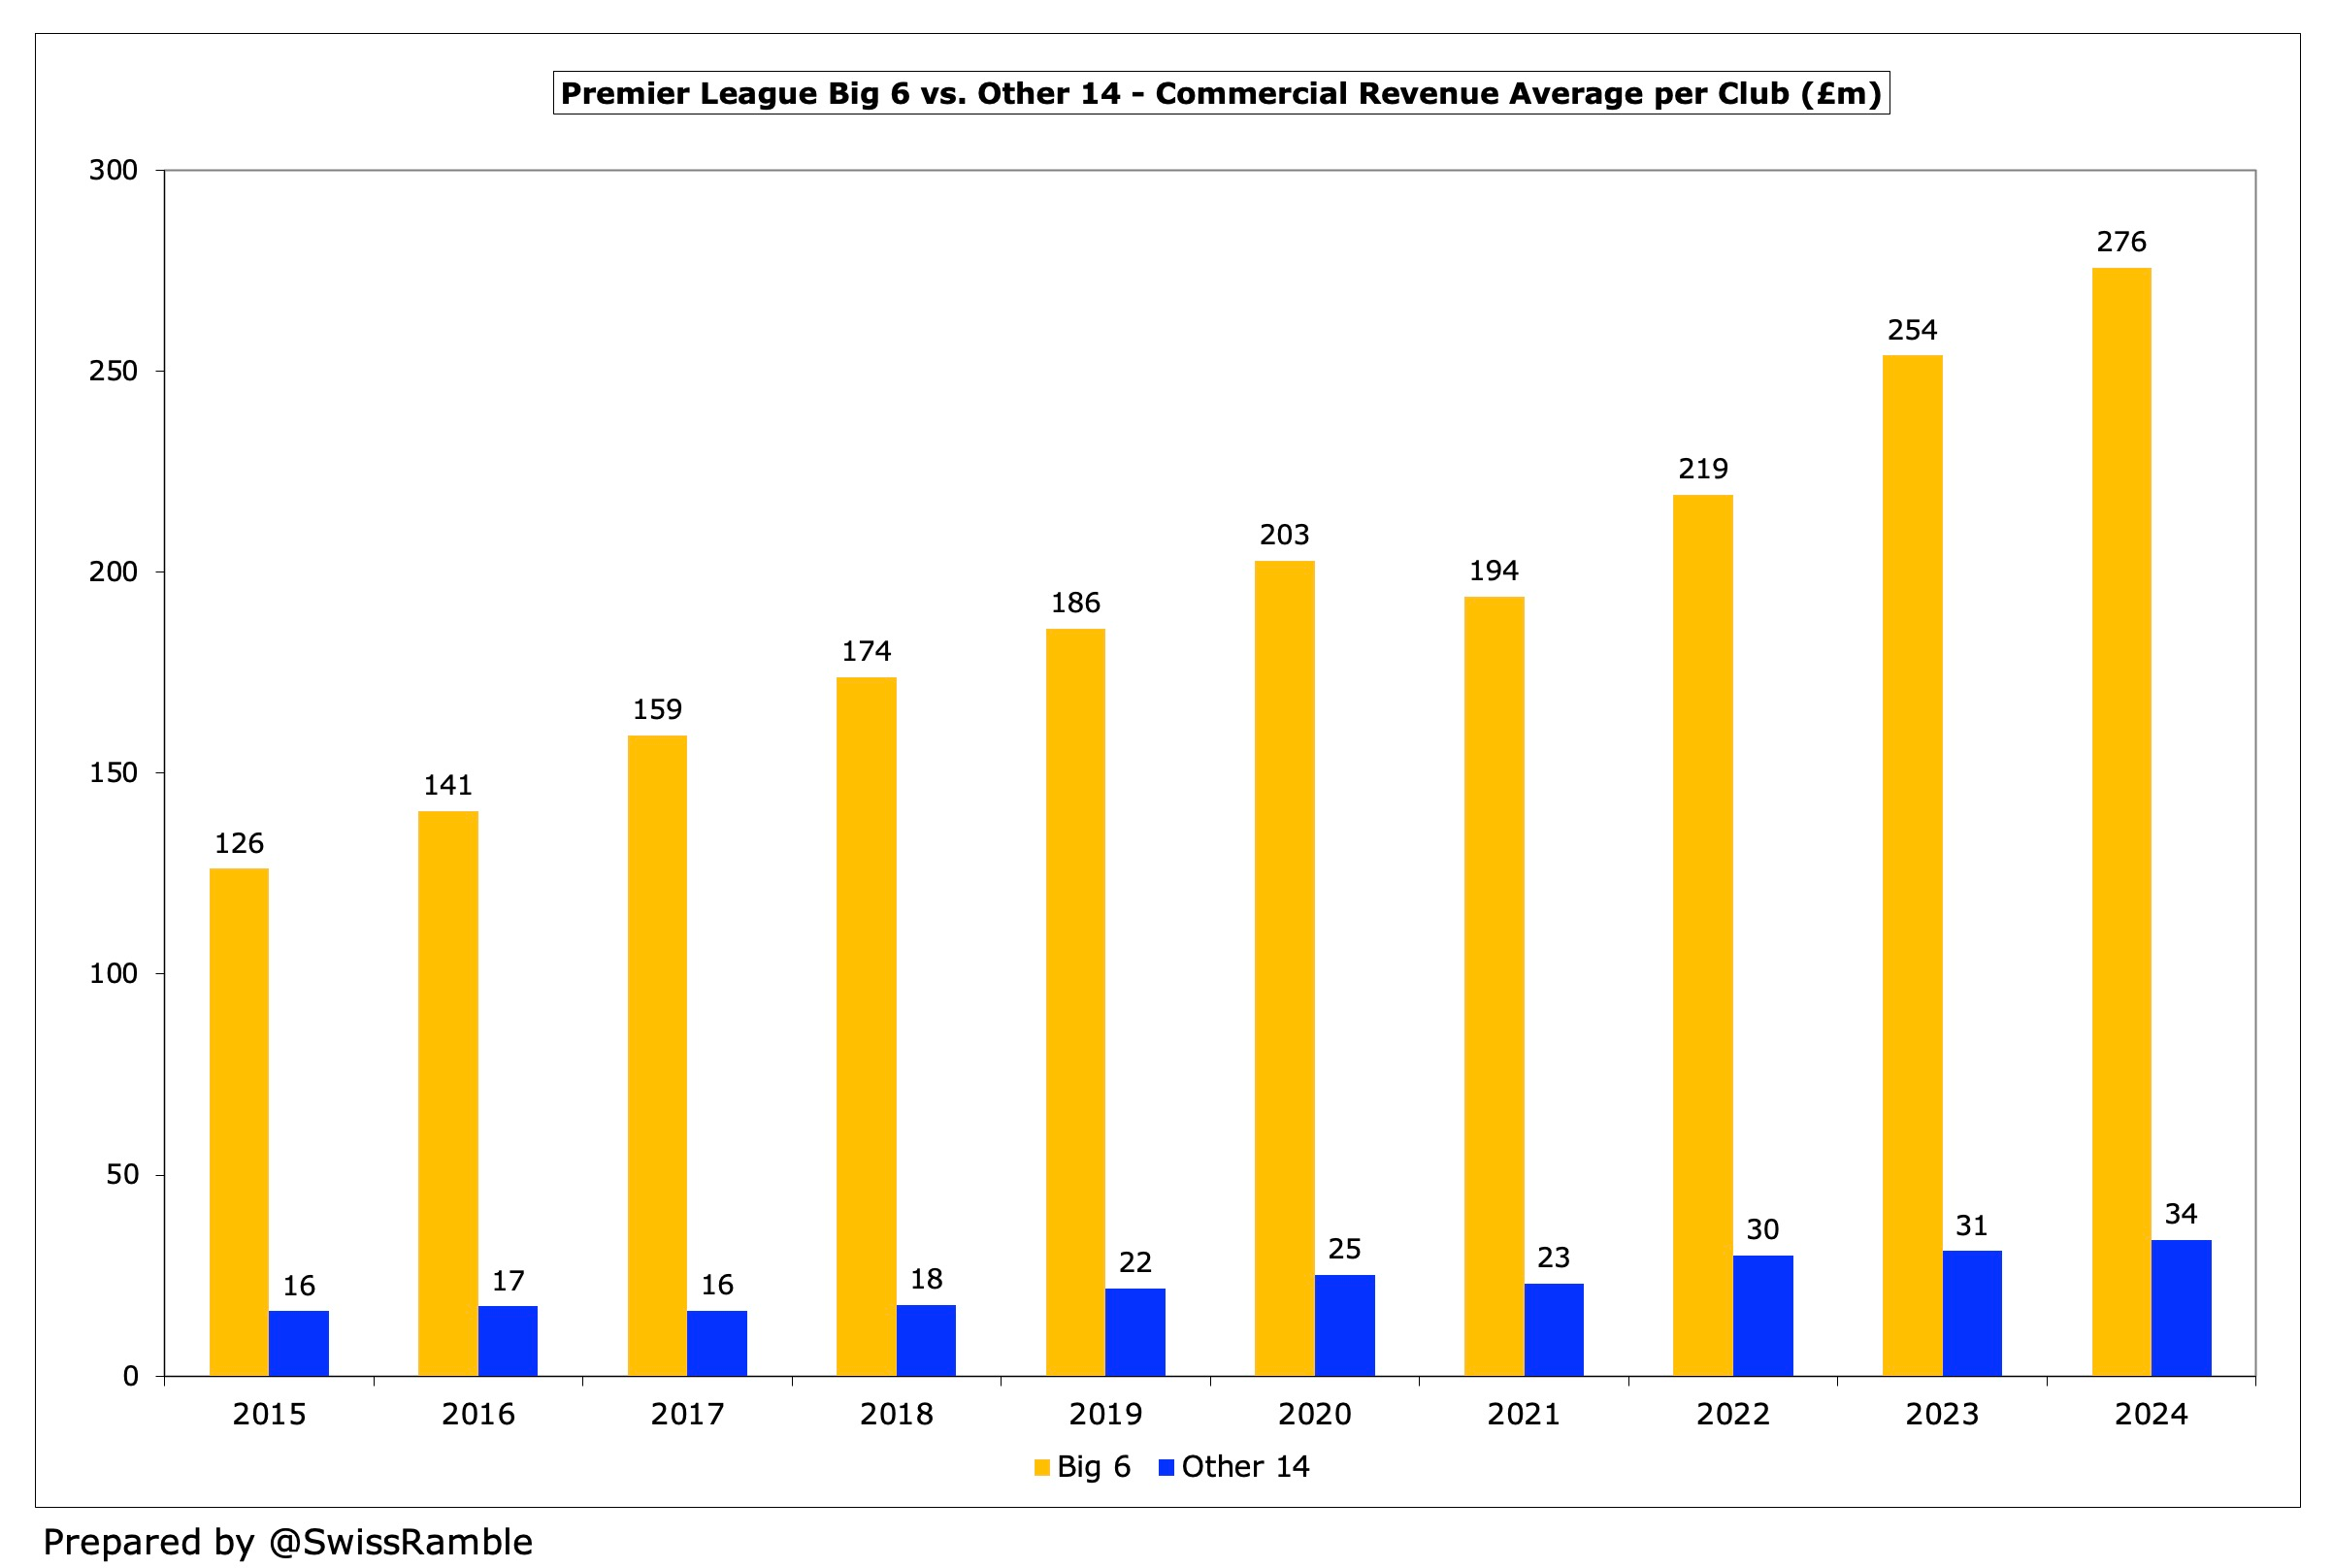
With the growth of the Premier League as the de-facto Super League, the access of more clubs to more lucrative commercial deals has also increased.
Because of a lag in reporting, we won’t have the most up to date numbers but it does appear that commercial revenue in the Premier League has doubled in the last 10 years and among the “Big 6” teams has grown at a healthy rate coming out of COVID. Here is a great graphic from Swiss Ramble on this.
What has also changed in addition to the broadcast and commercial revenue is the financial regulations in the Premier League. Last November the clubs voted to approve the new Squad Cost Ratio (SCR), to replace the old Profitability and Sustainability Rules. This moves from a set amount of acceptable losses regardless of revenues to spending rules that are directly tied to team revenues. SCR caps spending on the team (wages, amortized transfer fee, agents fees, and head coaching salary) to 85% of revenue, with a tax style system up to the 115% level (that overage amount reduces for repeat offenders) before the sporting sanctions kick in.
Teams in UEFA Competitions still have to deal with the stricter rules there but with record revenues and no longer bound by a fixed number, teams seem willing and able to spend more now.
What this means
Let’s bring things back to the starting question, with what is happening here with transfer inflation?
After a period of relative calm due to COVID, transfer fees in the Premier League have grown significantly. This is especially concentrated in the middle band of the market, the clubs outside the traditional top six have seen their financial power grow and they have flexed their muscles to acquire talent. The top end of the market where so much of the focus is hasn’t seen that same growth but that might be changing now this summer.
What I haven’t been able to account for here, is another part of the player cost. Transfer fees are the most public part of the player signing process but the actual salaries paid are just as important and are for most teams a larger cost. Including wages would be an important factor to consider if I come back to the analysis in the future.
The biggest change from the last time I looked at the transfer market is that the relationship between TV revenue and spending has become weaker and additional revenue streams are helping to drive teams' ability to spend. Spending relative to TV income sat in the same range for a long time, and it has now broken away and that might just be the new normal.
Looking at the current state, the new financial rules might also end up freeing up teams to spend more. Tying the rules to a team's revenue rather than a fixed loss cap creates a very different ceiling, one that grows with the game instead of sitting still, and without the PSR era's dynamic of harsh penalties unless you got creative with the loopholes.
I will be curious to watch how the rest of the summer finishes and what the picture looks like once we have the full view rather than just a partial snapshot.
I construct my inflation factor based on total EPL revenues. I grant it’s imperfect, it only truly provides comparability for EPL inward transfers, but given that’s what I’m interested in, does the job pretty well.