
Why xG Doesn't Need Fixing (But Our Communication Might)
It's less about problems with the stat and more about common misunderstandings (and how we can fix them)

On the Cannon Stats discord (it’s a pretty fun place to hang out and talk Arsenal/Soccer and free to join) a subscriber shared this video titled “The 4 Flaws Of Expected Goals”.
This seems specifically designed to needle me (and probably Adam too), but it’s a good video despite the bait-y title/thumbnail, and it really got me thinking.
The first thing is that this is not really a video about the flaws or xG but rather how more casual fans use xG and some of the more common misunderstandings of what the intentions are.
The video is only 18 minutes and worthwhile to watch in full above or on YouTube but for the rest of this I am going to pull and quote from the transcript of the video talking through the items brought up in the video.
Problem One: How xG Deals with game state
Again here, the theme is less that this is a flaw of xG and more of a flaw of how people use xG.
An xG model can incorporate the game state into the model for estimating the probability of a goal being scored and with basic event data where you are trying to infer more things like the likelihood of more/less defensive pressure, it probably should include this.
My model does include a game state variable for open play shots, it is not a massive factor compared to others but including it helps to make things more accurate.
The example brought up here is a good one with a hypothetical FA Cup match between Sheffield Wednesday and Manchester City. In this match Wednesday get an early goal and then defend for their lives to hold on, with the match finishing 1-0, but with an xG that is 0.07 to 1.88. It’s a match we can all imagine and it describes a real thing that we have seen before.
From the video:
Now, if you just looked at xG for that game, you’d say Man City were robbed. City deserved to win. They clearly battered Sheffield Wednesday. That Sheffield Wednesday team are a disgrace. They must be awful at attacking. I mean, just look at the difference in xG. City clearly played better based on that xG.
This is something that you would hear after a match like this and some of it might even be true! It could be harsh as the video points out because they did win but that’s some of the beauty of this low scoring fun game that we love.
Continued on:
They got the goal the underdog needs, and they got what they needed to win the game. And they knew that trying to attack anymore would just be leaving space for Man City to exploit. They earned this victory. They deserved the win. And it’s not unreasonable to say that they played better than Man City, at least in the sense of playing better, meaning realizing what their match plan is and successfully executing it.
It’s hard to do analysis on a hypothetical match so maybe some of this is true but I am not sure that it would be universally true.
Stopping attacking at all, is generally not a good idea, a team should probably take fewer risks but going from 1 goal to 2 goals up is huge for a team. With the opposition potentially taking more risks to score themselves that can leave opportunities to counterattack and maybe in this match that was there and they failed to take them, which could be described as not attacking well.
As for “deserving” to win or playing better that is again hard to say on a hypothetical match and is a loaded term. If the game plan is scoring a long-range screamer and then hope for bad finishing/great goal keeping that’s probably not a great game plan.
Continued on:
And this is the problem with xG and match state. xG on its own can’t tell us when a team is just bad at attacking or is intentionally not attacking. It can’t tell us the difference between a team who, when they get the ball outside their opponent’s penalty area, pass backwards because they are too rubbish to create a chance versus the team who pass backwards because they want to keep the ball and stop their opponents attacking.
I don’t think that this is a problem with xG or a problem with xG and game state.
xG can’t tell us these things because that is not what it is supposed to or designed to do. It is the old, trying to use a screwdriver to hammer in a nail problem, that is just not what it was designed to do and it will not be effective at this. xG is an estimate of the quality of a shooting opportunity but it makes no attempt to try and say about attacking intent.
Game state and when goals happen is important information and should change how you use xG to analyze a match. This is a good topic to bring up even if I think that the video here misses the mark on the critique.
After a match you will often see just an aggregate expected goals number posted on social media, or in an app, or even on match of the day. The total xG for and against is helpful to know but it will leave out potentially important context, including the very important timing of the goals and the chances.
For a single match you will almost never find me post just the total xG number and my standard would be to include a number of graphics that help give you good information about when the chances happened and how good each chance was.
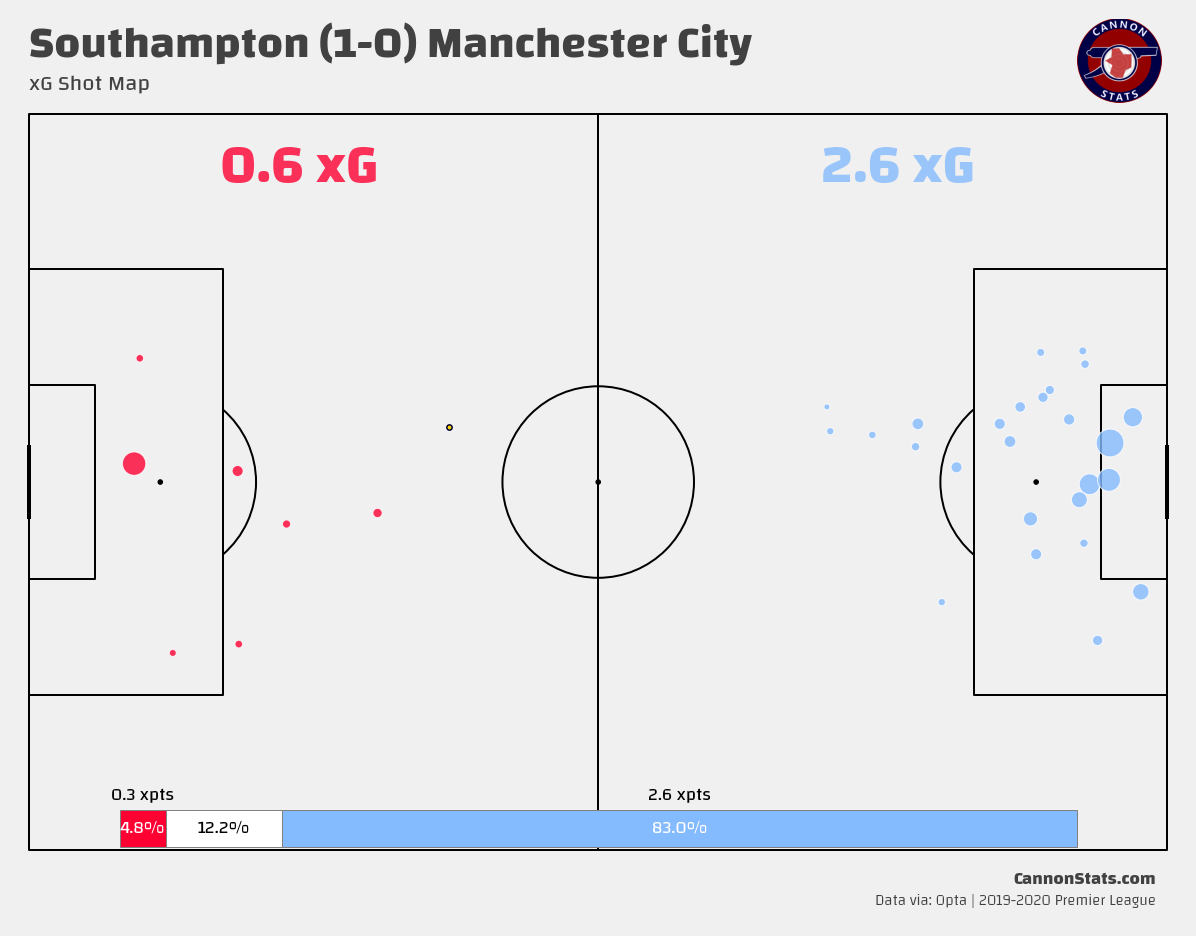
If we want to piggyback off of something similar to the video here is a good real-world example from the Premier League from 2020, in July Southampton beat Manchester City 1-0 from an early goal and were battered on expected goals. The aggregate xG scoreline here was Southampton 0.6 to 2.6 for Manchester City.
Looking at just the aggregate xG or even the shot map here, you can see that Manchester City did create a ton more chances and this looks like a real footballing injustice. The goal that is scored here is a 40 yarder as well!
The xG race chart gives us a bit more information and context.
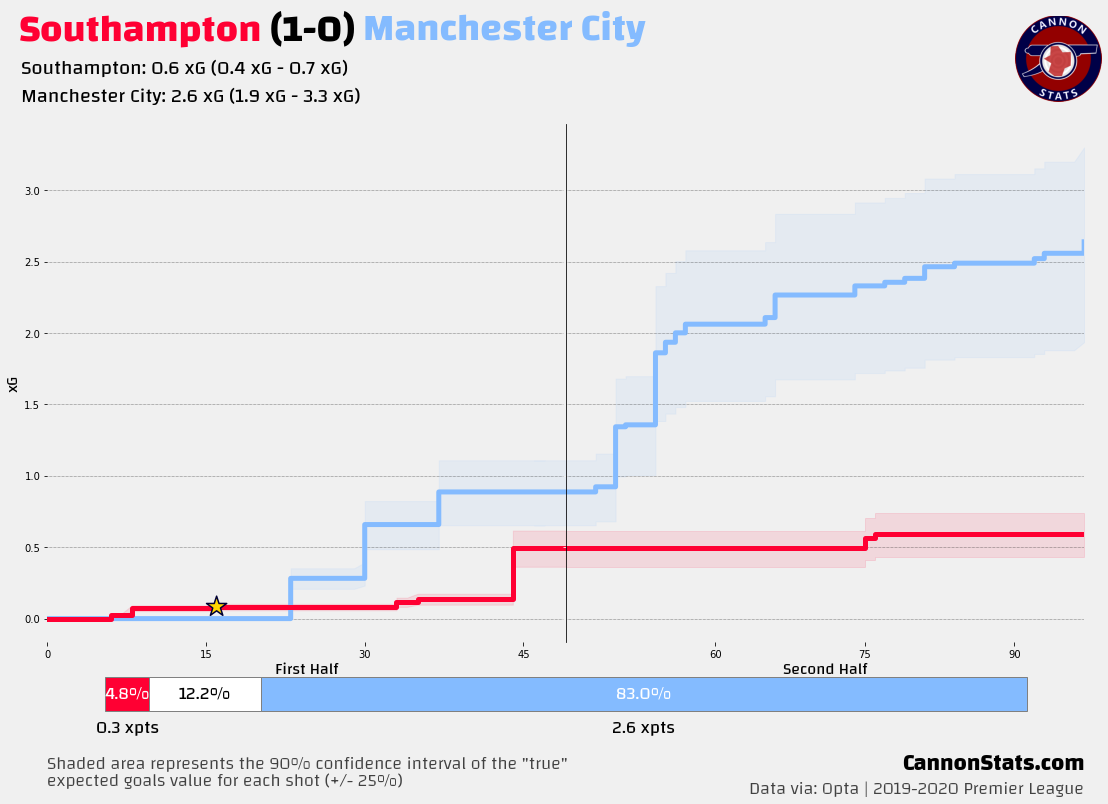
This shows that Southampton did seemingly execute their game plan fairly well in the first half, they didn’t allow a shot until the 23rd minute and by that point they had already taken 3 (not great shots but still shots) and scored a goal taking advantage of Ederson off his line on a turnover. In the middle period, City did create a number of openings (with Southampton also generating a good look for themselves) but in the later part of the game they were held to taking a number of low probability shots through a packed defense.
Having a bit more information really helps to be able to understand this match a bit more and that is something that can be lost in single game discussions of xG.
Problem Two: Sample Size
This section is spot-on advice but doesn’t belong in a ‘flaws of xG’ video. Sample size issues apply to all stats; pundits and fans often ignore them. This is the crux of the section:
The reason sample size is a problem for xG is that the way people talk about xG often does not take into account the importance of sample size. And again, here stats nerds, I’m not talking about you. I’m talking about some pundits, fans, and journalists.
This is just commentary that is not pointing out a flaw of xG but rather pointing out that a lot of the discussion around sports is like the classic xkcd cartoon:

This advice is good for all sorts of things and not just for using xG, if you want to try and draw conclusions it is helpful to have more information. At a team level you really want to see sample sizes that are at least 8-10 games. For players you want something similar and 900-1,000 minutes as the base size that you want to look at. If you are interested in things like shots and finishing, I typically want to see at least 75-100 shots.
Problem Three: What xG is vs what people think it is
This problem is again one that is not a flaw of expected goals but is rather directed at how people use it.
When fans, pundits, and journalists use xG, they often use it as a proxy for quality of chances created. In current football discourse, when I say Man City got 2.05 xG, people understand that what I mean is Man City had roughly two goals worth of chances. They should have scored two goals. But that’s not true. Instead, an xG of 2.05 means Man City had roughly two goals worth of shots. And that is importantly different from two goals worth of chances.
This is true but I think that it also goes down to the language used to describe things that happen in the game can be a bit loose. Shots and chances are used interchangeably, and I am sure it is something that I have done too, especially thinking about something more like key passes and calling it chances created.
Let’s continue on here.
Shots are not the only goal scoring chances. And my main case for this difference between shots and chances is the humble cross.
A shot can be the result of a goal scoring chance but yes, he is right they are not the only outcome from a good opportunity to score. We have all seen last ditch tackles or balls played through that are just a bit too far in front of a player.
There is actually an event that is collected in the Opta event data called “Chance Missed” and this is used when a player does not actually make a shot on goal but was in a good position to score and only just missed receiving a pass.
Here is the full definition on this event: “A big chance opportunity when the player does not get a shot away, typically given for big chance attempts where the player shooting completely misses the ball (air shot) but can also be given when the player has a big chance opportunity to shoot and decides not to, resulting in no attempt occurring in that attack.”
This doesn’t show up too often in the data, but it is collected and potentially accounted for in xG (provider specific still).
Let’s see where this goes next.
Crosses are a vital part of football. They always have been… We all know that getting a cross into the box can frequently create really big chances to score. Be that a floated cross up towards a big strong target man or a cross along the ground in the six-yard box for the quick winger to tap in at the far post… But xG can only account for a cross if it results in a shot… But there are loads of examples of crosses clearly being very big goal scoring opportunities even though no one managed to get a shot from them.
We will go into crosses more in a second, but this is again a critique of xG for not doing something that it is not trying to measure. Remember it is the estimate of the probability of a shot being converted as a goal, and if there is no shot what would be the expectation that should be given there?
If you want to measure this, you can use other metrics that are designed to try and estimate these things. My own version of this would be goal probability added, which looks at the probability of scoring from different zones with different actions.
Now let’s talk about crosses. I do agree that crosses are a vital part of the game and they are a key tactic for generating shots and balls into the box. They certainly can create really big chances to score but really they are not an amazing way of creating shots and goals for the volume.
In the Premier League this season (through 2025-12-31) there have been 4,830 open crosses attempted, 1,026 have been completed, turning into 434 shots, and 39 goals scored. Just 21% of open play crosses are completed, with just 8% turning into a shot and just under 1% turning into a goal this season. Typically, the goal conversion rate is more like 1-2% but you are talking about needing somewhere between 60-100 crosses to generate a goal.
Not all crosses are equal, and it will vary based on where you are crossing from and the type of cross that you are doing. Overall, they’re low efficiency (needing 60-100 for a goal historically), so missed crosses not being included in xG isn’t a major issue, the best executed ones usually lead to shots and are counted
Continuing on.
Unless a shot is actually registered, xG does not take this into account. And that would be fine if everyone used xG to mean the combined likelihood of a team shots resulting in a goal. But they don’t. Instead, people use xG to mean how many goals should we have scored from our chances.
I don’t know if this is nearly as big of a problem as is suggested here. Maybe it is a blind spot of my own, because I am actually aware of what xG means and know that it is only if a shot is taken, that this is exactly how I use it. Maybe making this clearer can be helpful so that more people understand it fully.
Problem Four: What doesn’t go into factoring xG
This is a highly relevant section and something that seems to come up quite often and it is about using who takes the shot in estimating the probability of a goal being scored from a shot.
From the video:
I think this misses one very important factor when considering whether a player will score with their shot, and that is who that player is. Give the same chance 10 times to a League 2 center back and then give the same chance 10 times to Erling Haaland, and I know who I’m backing to score more times out of 10.
What is presented here I agree with. Haaland is without a doubt in my mind a superior goal scorer than a League 2 center back.
This is also a different question than what xG is looking to be able to give information about, xG is an estimate the probability of an average player converting a chance based on the characteristics of the shot and not the shooter’s ability. By using the average player as the baseline, the difference between a player’s actual goals scored and their xG helps to uncover the skill of the player.
This extreme hypothetical is also one where you are specifically using a player that would be out-of-sample, this means when you would try to use an xG model for them, the accuracy would be questionable.
xG nerds want this stat to be a measure of the average quality of a shot precisely because they want to measure whether players or teams outperform how the average player or team would have done. That’s why xG exists to measure the over or underperformance of a player’s strike relative to all other players.
Exactly. This is not the only reason that xG exists, it is also a better predictor of future goals scored than goals alone but yes it can help give important information about the relative quality of a players finishing.
Continuing on.
And that’s fine for the xG nerds, but it’s a problem for xG as it’s used by everyone else. Because as I’ve already pointed out, we use it to basically mean how many goals should this team have scored and therefore whether they deserve to win or lose. And that doesn’t work when we don’t take into account who the team has managed to create the chances to shoot for.
This is again a critique that is based around something that xG is specifically designed not to do. It is possible to do this and there are models that have been created that do include an estimate of player skill, but for me, I start wondering if the juice is worth the squeeze on if the extra complexity adds more accuracy.
If a model explicitly included a "player quality" or "player finishing ability" feature in its training data, then using that model to evaluate player quality could become circular. The model can't objectively tell the difference between "a great chance" and "a great player" because you’ve blurred the lines in the input data.
The further you get away from a sample of hundreds of shots the more uncertainty you should add to any single xG estimate. When we are looking at individual shots, I like to think of xG as the midpoint of a range of potential probabilities (I use +/- 25%) and the “true” probability lies in that range most of the time. While we can base the estimates off similar shots, there are always little things that make it unique (including player quality and goalkeeper quality) that will always complicate things.
For the players that have taken 200+ shots in my shots database for the big five Leagues the distribution looks like this:
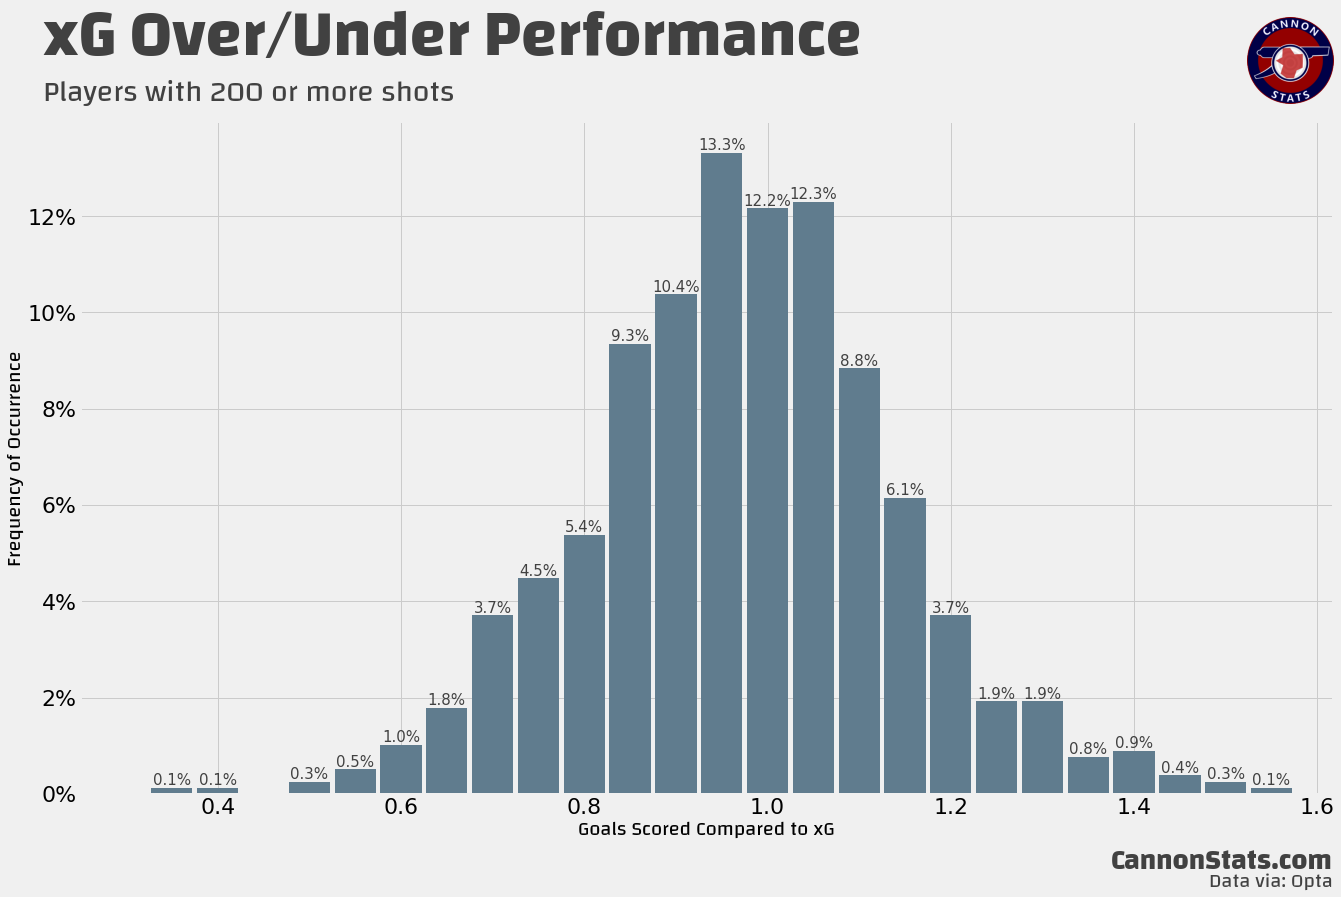
The standard deviation here is 17% and it is centered a 1 (goals = xG), this would place 95% of players between this +/- 25% that I use as my error bars.
Let’s continue on.
To see this, imagine two cases. In both cases, Man City are playing Liverpool. In case one, Man City managed to create enough chances for Erling Haaland to have 1.5 xG, but no one else on the Man City team gets any xG. In case two, Man City managed to create enough chances for Ruben Diaz to have 1.5 xG, but no one else gets any xG. In both cases, Man City’s overall xG is the same, 1.5. But I think it’s very clear here that Man City have played better in the first case because they’ve created better chances because they have managed to get those chances to fall to their best finisher. In the second case, they’ve got the exact same xG, but this xG is falling to possibly their worst finisher.
This sounds fun and let’s play around with it. From my shots database this is what each of the players looks like, including an estimate of finishing skill that was estimated using Empirical Bayes (EB) Shrinkage.
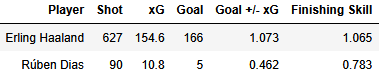
Haaland has taken a ton of shots, and he does show up here as a player that converts his chances at a better rate than average. Given his high volume of shots, his estimate for finishing skill doesn’t change all that much.
Dias is at just 90 shots but does look like he is profligate in front of goal. That sample size is still on the small side and because of that our estimate here of his finishing skill is adjusted towards league average.
If we just go with a simple assumption that all of the shots are 10% chances and then adjust for finishing, simulating the match against each other would look like this:
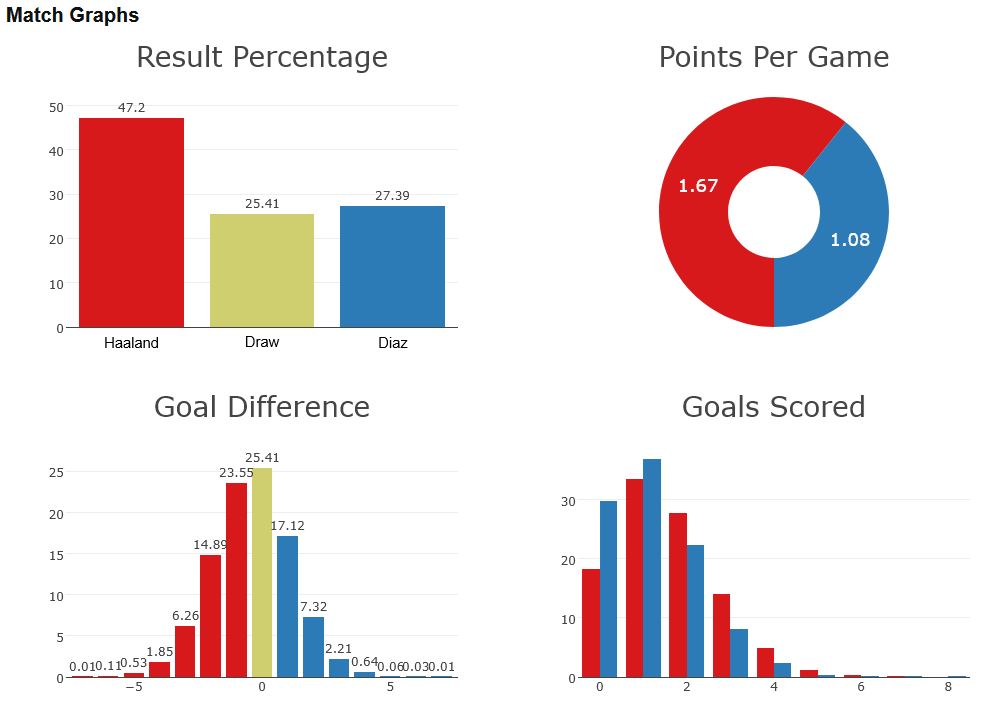
The Haaland team would expect to score on average 1.6 goals per match, while the Diaz team would be expected to score on average 1.2 goals per match. This does show that perhaps that adding a finishing metric could make a bit of a difference in adding accuracy but even in this is a purposefully extreme example, and the differences aren’t that large.
Continuing on.
The point being xG as we use it colloquially fails to account for the fact specific players take these shots and those players might be better or worse at shooting… This means that we cannot use xG to definitively say a team created better chances than another because the quality of that chance depends on who the team has managed to get to take the shot.
If we take Manchester City’s last game against Sunderland where they produced 2.26 xG and adjust for the finishing skill of the players that changes to 2.32, that adds just under 3% to the total expected goals in this match.
The very confident “we cannot use xG to definitively say a team created better chances” to me would be a bit overdoing it. Adding in a factor for player skill does slightly change the estimates but they are significantly smaller than what I view as the standard error bars around the estimate of a single shot.
Given that I think there is a good reason to stick with the average player baseline I don’t think that I will be doing any adjustments to my expected goals, but it was fun to go and come up with player finishing estimates.
Final thoughts
Like I said at the beginning of this post, while I have critiques and comments about the video, I did enjoy it and love that it got me thinking about expected goals.
I think that there are things that people like myself, who use stats to analyze the game can try to do more and better to educate people on what the numbers mean and what sort of ways that we can gleam insights from data.
That was really my big takeaway from this, rather than xG having big flaws with it, it is much more of a how the public uses it and understands what these numbers mean problem.