
13% of Arsenal's matches with Oliver have had a red card, how improbable is that?
It is still within the random chance range but it is an outlier that raises suspicion and doesn't inspire confidence that something fishy is happening.

13 Percent.
That is the percentage of matches that Michael Oliver has been the main referee for Arsenal in the Premier League where he has shown a red card to an Arsenal player.
It is 7 red cards in 54 matches. (It seems there might be some dispute in the data here, Whoscored has it with 55 matches and 8 Red cards for his career, I am not 100 percent certain but for this which is correct and will do analysis with both figures.)
That’s pretty crazy but how improbable is that?
That was the question that I had when I saw that stat, and given that it is a pretty big talking point I thought it warranted a quick look.
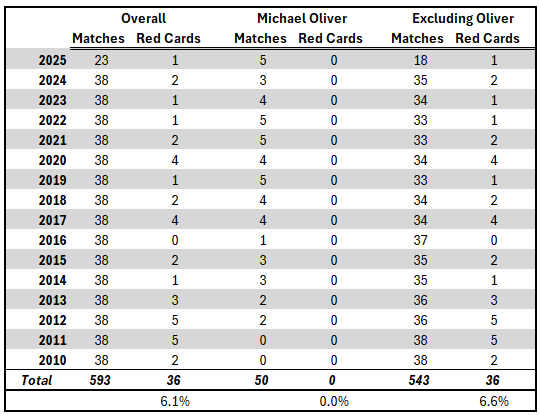
To try and get a feel for this, I pulled some stats on Arsenal and Oliver in the Premier League, with the overall discipline record. This is the highest level since Oliver began refereeing in the Premier League in 2010.
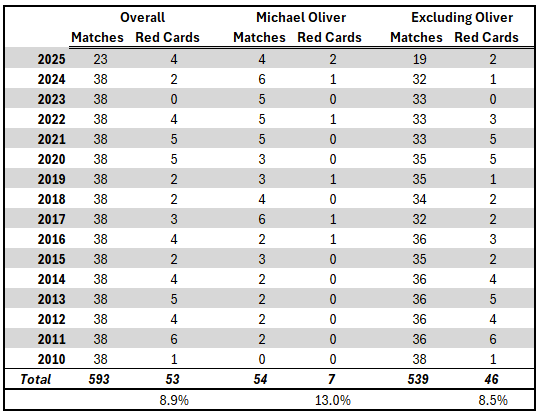
Arsenal haven’t been a particularly undisciplined team, averaging a red card every 10 matches or so and about 3 per season. The highest was the 2010-2011 season where Arsenal had six red cards and a low of zero red cards in the 2022-23 season.
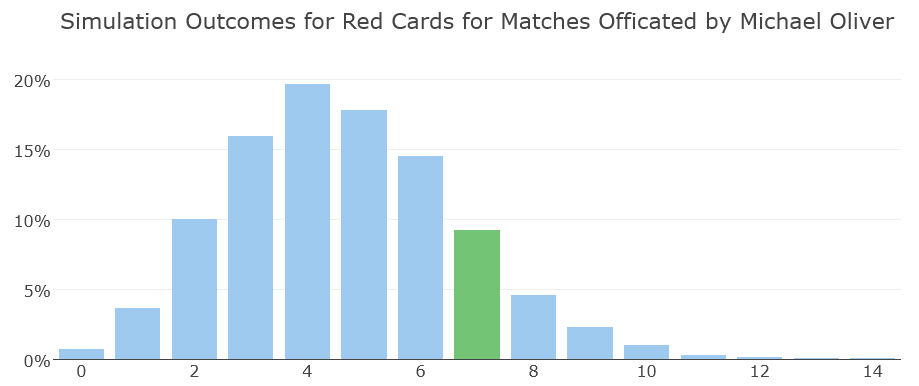
At a high level, the 13% number does look high and out of place. The stats say that it also doesn’t look great. Taking the assumption (I don’t know of a better estimate here of true ‘red card worthiness’) that what Arsenal have done in the non-Oliver matches as the baseline would have Arsenal expecting to see between 3 and 6 red cards rather than the 7 they have actually gotten.
This is 1.65 standard deviations away from the average and would translate to a p-value of 0.09, which is above the standard cut-off of 0.05 for statistical significance.
This is also a situation where Arsenal look like an outlier compared to the other teams that he has refereed more than 10 times for the number of red cards that they have gotten.
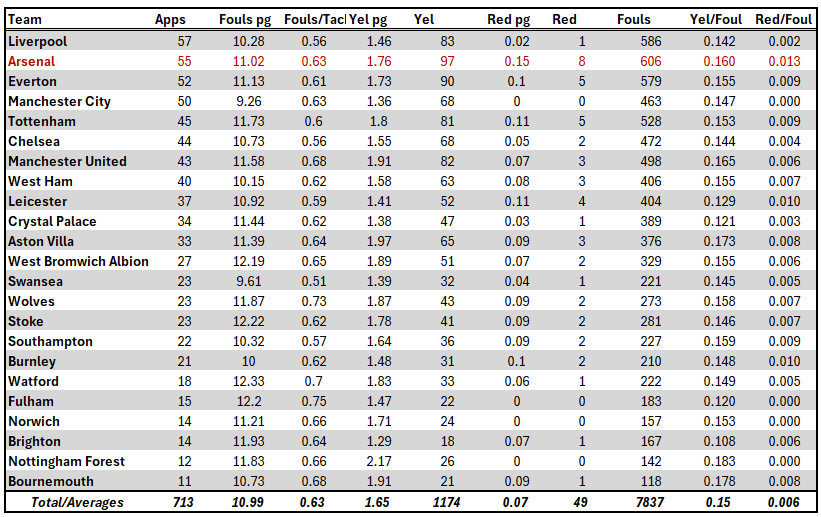
This still could be nothing, by random chance, there will always be teams on the right and left tails on a distribution but it doesn’t do much to help people feel better about Oliver as a referee for Arsenal. Arsenal matches represent just 6% of the 968 total matches Oliver has refereed, the 8 total red cards given to Arsenal players represent 12% of all 67 red cards he has shown.
Since 2015/16 Oliver has given Arsenal 7 red cards fo 23% of Arsenal’s total red cards over this period, he has done this while refereeing just 12% of Arsenal’s total matches over this period.
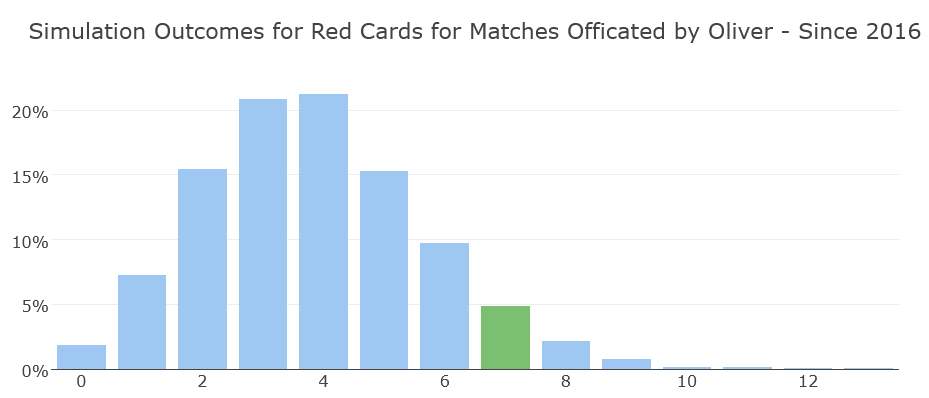
In this period we are starting to get even more into outlier territory. For this if Arsenal really are a 0.89 red card’s per match team you would expect 3-5 red cards but we have seen 7, which is one and a half standard deviations away from expected. This isn’t quite hitting the threshold of the 0.05 p-value for statistical significance (0.14 here) but it is almost certainly something that we would want to watch.
Using the WhoScored data things look even less likely to be more random chance.
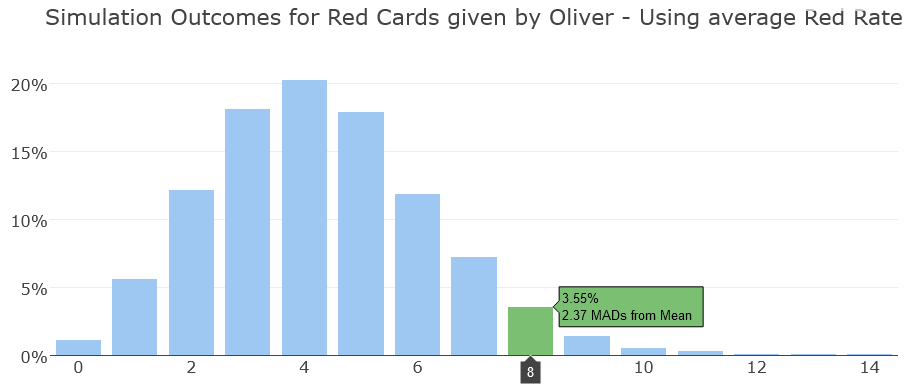
Instead of using Arsenal’s 8.9% red card rate, for this I took the average of Arsenal’s and Oliver’s rates for giving out red cards, which came out to 7.7%. Using this and 8 red cards for 55 matches now looks like a massive outlier 2.37 mean absolute deviations from the expected mean. This is still just short of the statistical significance threshold at the 0.05 p-value level but is very very close (0.08 here).
This isn’t exactly a satisfying answer to say this is an outlier but still not such an outlier to not be random chance at this point but that is where the data points right now. My eyes for some of these Red Cards don’t quite buy it given that many of them seem like such 1 of 1 situations that you don’t see often. I will for now trust the numbers but I continue to be skeptical of how Oliver is refereeing Arsenal.
A little post script here after some discussion in the comments I added in a quick and dirty look at Oliver and Manchester City.
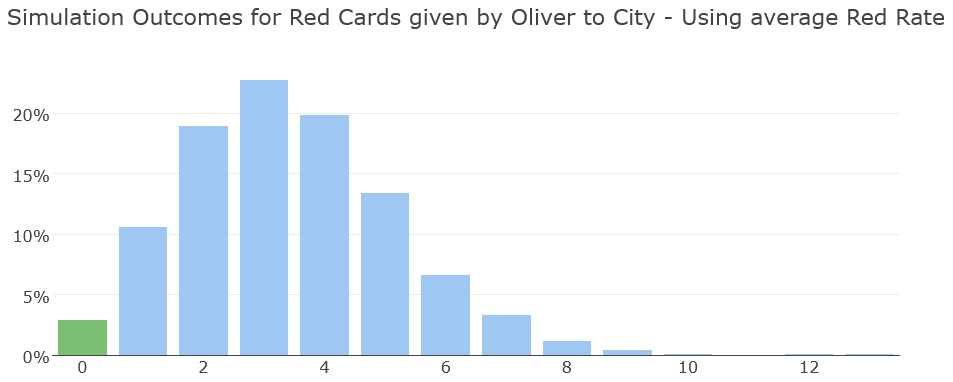
This again seems like an unlikely outcome but this time it IS statistically significant enough to not be random chance. The 0 red cards is -2.4 mean absolute deviations from the expected mean, and given the 1.4 standard deviations expected here you get a p-value of 0.008, suggesting that this being random would be about a 1% statistical probability (if the assumption that Manchester City should get a red card 6.7% of the time they play a match).
Here is the overall breakdown of Manchester City discipline record with and without Oliver:
So, I went and did some maths as well, what I found was, amongst the teams he's reffed the most, what's REALLY interesting is the distribution, because it's SO WEIRD that he doesn't really seem to give Liverpool or City red cards. oh no I've made a table:
https://docs.google.com/spreadsheets/d/e/2PACX-1vSel8zFa1OPYTNqxodZbpxfAdkFupIwfgl4fPlwHgn5h6YDiNP7LadzHbi_AbRq0GJpuR9U_CUnXCRK/pubhtml
It's the distribution of 7 in 54, 0 in 50 and 1 in 56 that has me reaching for my tinfoil hat. It pushes the SSZS beyond what ranomness would explain. Despite the pretty normal numbers for the other teams he's officiated regularly.
I love this approach. Curious what patterns emerge if we broaden the sample to current and upcoming opponents of Man City that Oliver has officiated where cards distorted match outcomes. I hope the club is also putting some data science resource to scrutinise Oliver’s highly unusual refereeing behaviour.