


Arsenal KPI Check: November/December 2023
Checking in on Arsenal again compared to preseason expectations

Over 40% of the Premier League season has been played and we can start getting a pretty clear picture of what the teams are. This is also a good time to break out one of my favorite reoccurring posts, looking at how Arsenal are doing on key metrics compared to my preseason expectations.
For the items presented below the blue line is the average for the season, the red line on the current season is what I set out as my goal for Arsenal’s season to be a ‘success’ (the average of 1st/2nd place metrics).
Points
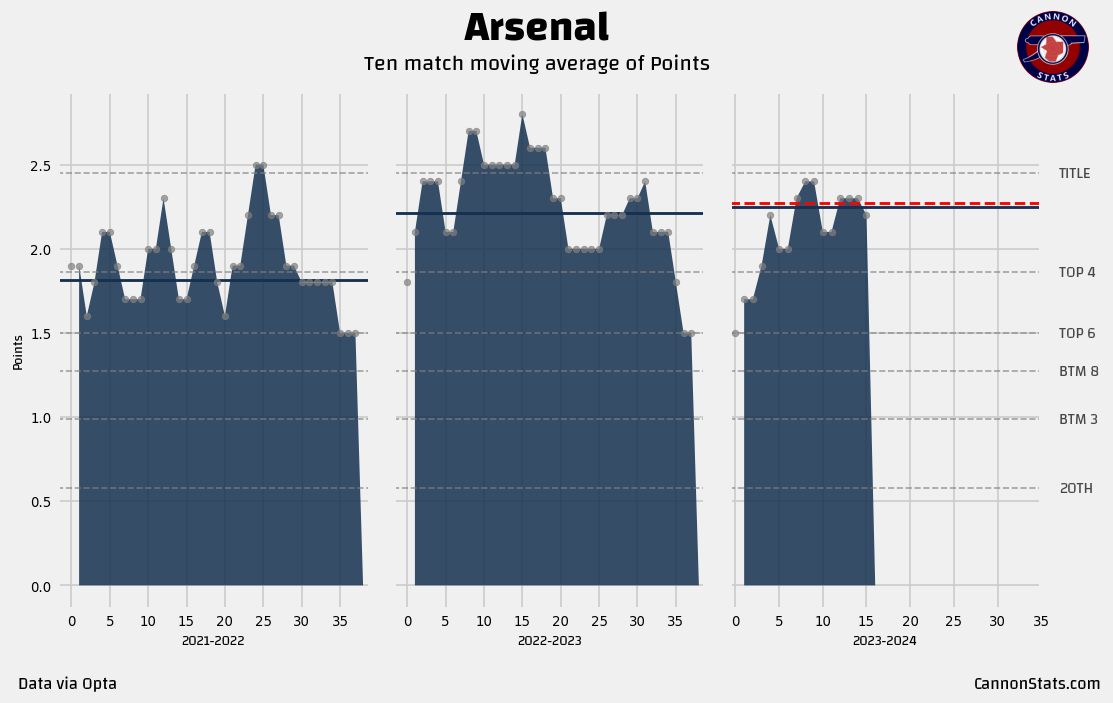
Arsenal are second place in the table, one point off first. Arsenal are currently on an 85.5 point pace and holding steady in the title race.
↔️On this measure, Arsenal are meeting the expectations
Expected Goals
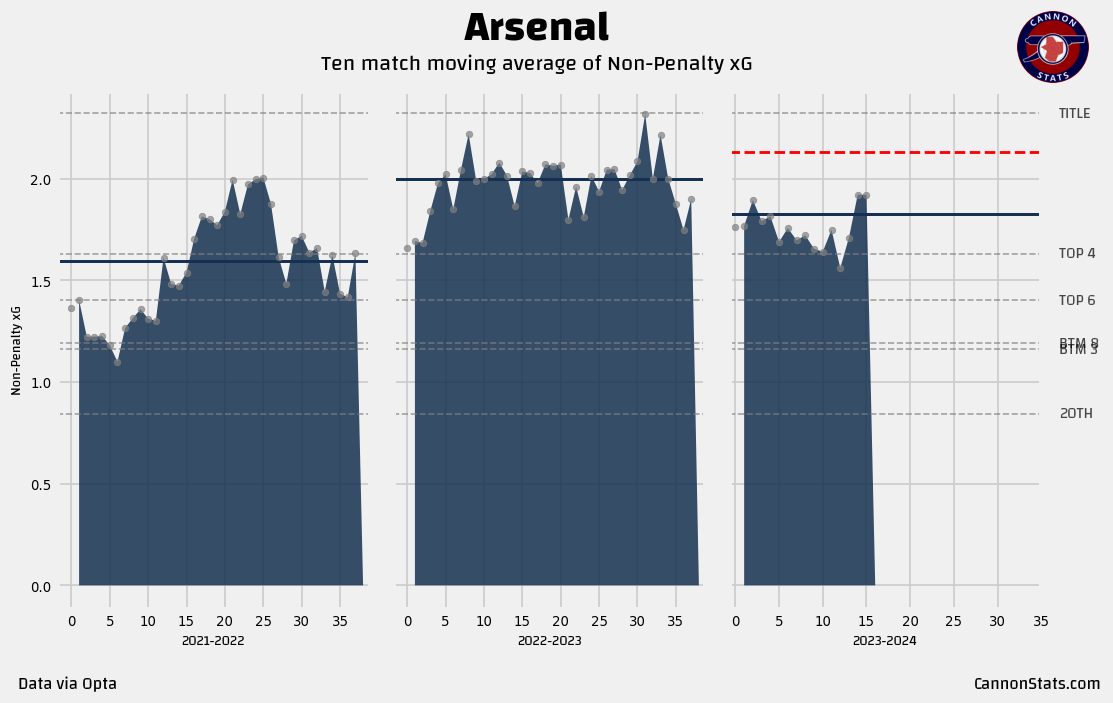
Arsenal's expected goals figures are not the greatest, ranking 10th in the Premier League this season. There are lots of potential reasons, favoring control, more deep blocks, injures, etc. but it is still the clearest issue that might hold Arsenal back from finishing at the top of the table.
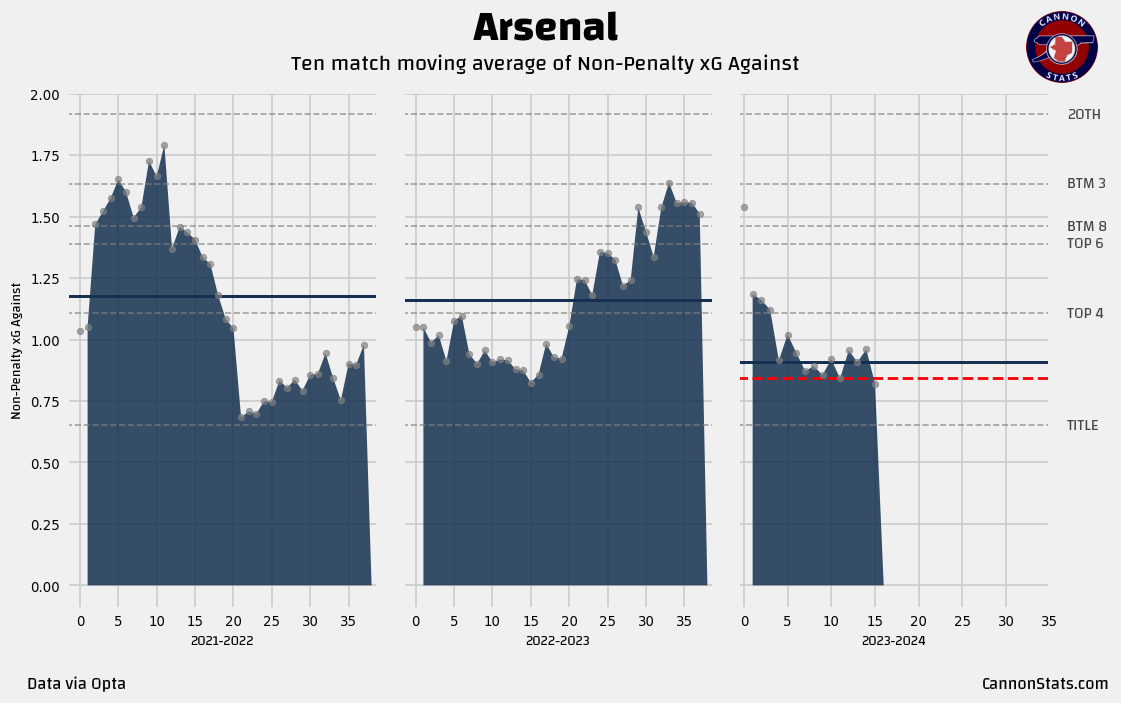
For expected goals against I set a target of lower than 1.0 because I thought looking to get to the average of 1st/2nd would be too much and I perhaps underestimated what was possible. Arsenal are beating that and have shown that they are an elite unit, with really only self-caused errors.
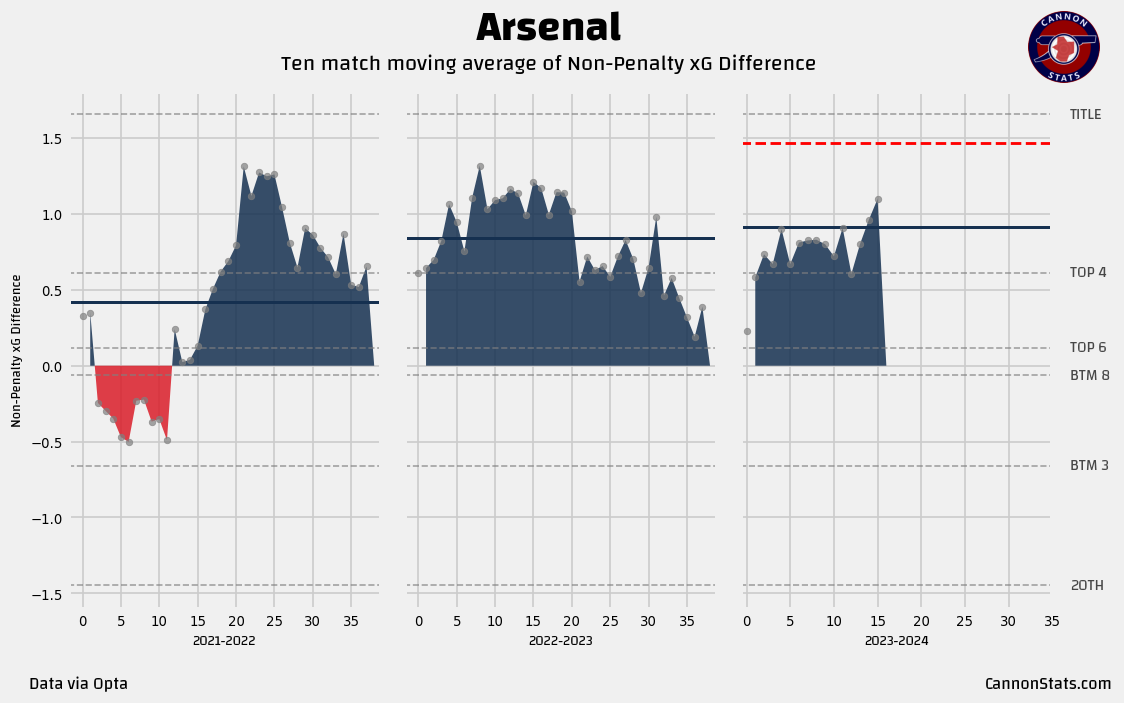
For the overall expected goals difference, I set a target of over 1.0, where Arsenal are lagging a bit behind the goal but are not far off. If the attack can pick up they should close the gap on this measure.
↔️Arsenal’s expected goals results are mixed. The attack is not as good as expected, but the defense has been. Overall it has left Arsenal in a below-average area for a title challenge but solidly as among the best teams with no team running away with things.
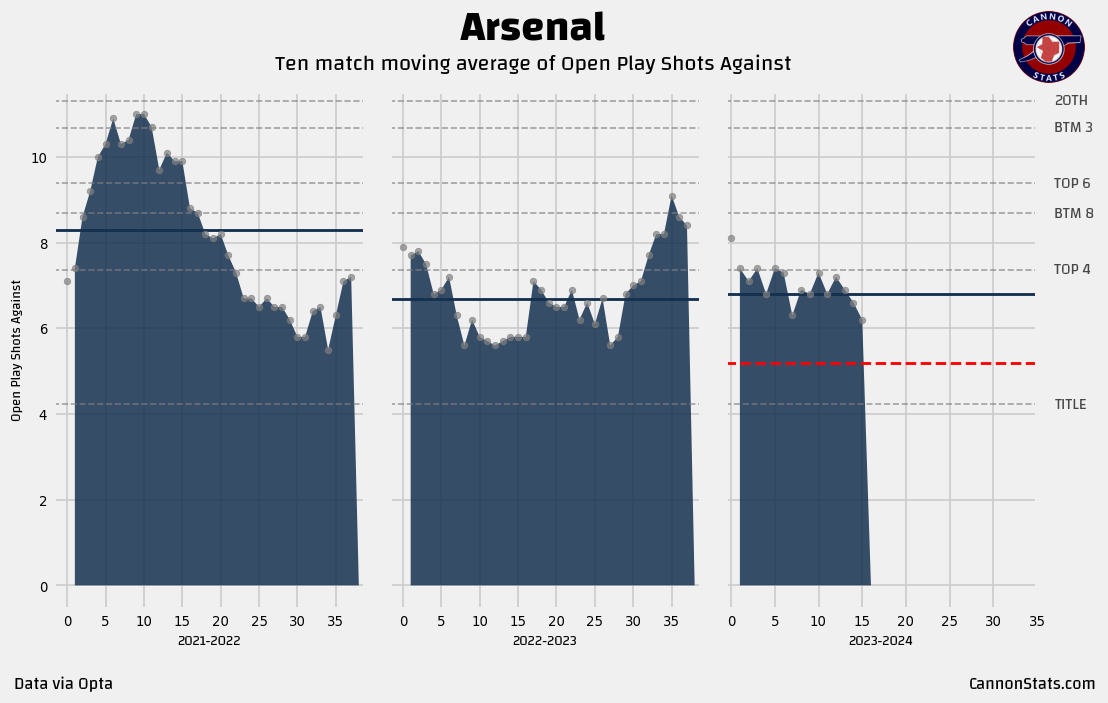
Shots
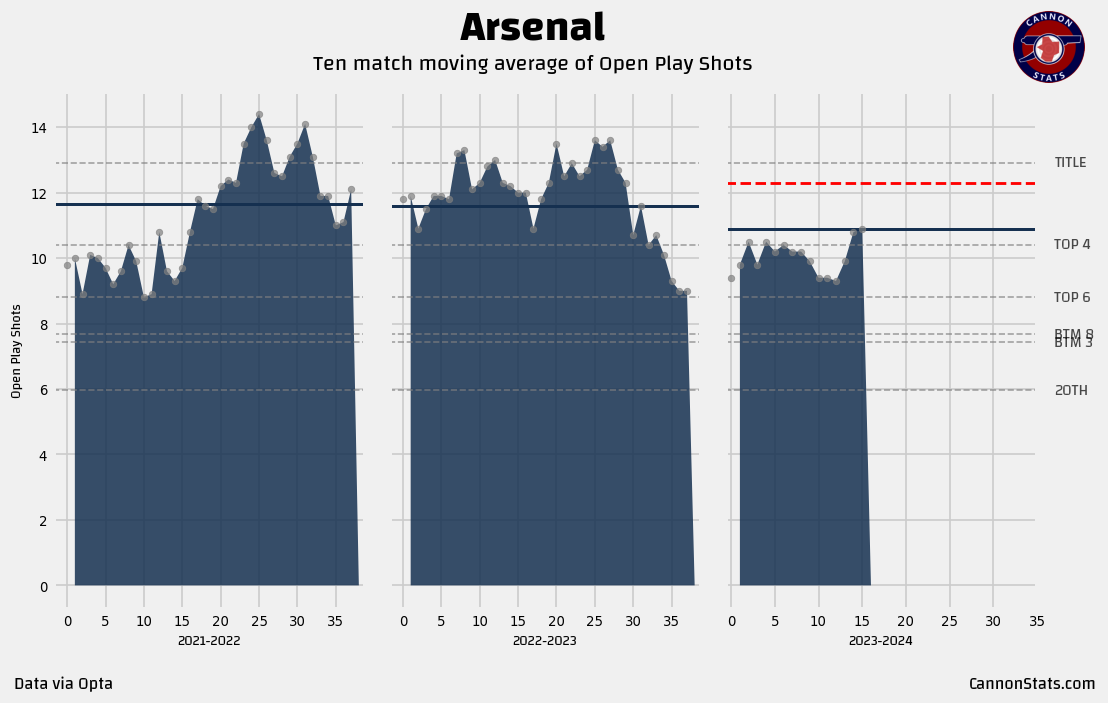
If you want to point to where things might be a problem in the attack this is probably it. Arsenal have been one of the best teams at generating shots and goals from set plays, they have even earned themselves a number of penalties with the pressure that they put on the box.
What they have not done is generate a good volume of shots from open play.
Since the resurgence in the later half of 21/22 when Arsenal have looked like one of the best teams in the league, it has been driven by the ability to generate a good volume of high and medium-quality chances from open play. This year they have lost 1.5 shots per match from these situations. That doesn’t feel like a ton but over a season that probably translates into 6-8 goals potentially missing, and maybe in the range of 3-5 (or more) points depending on the sequencing of things.
On defense, I don’t really have any complaints. The team has done really well at not allowing high volumes of shots and perhaps even more importantly has limited teams to the second-lowest average quality.
↘️On this measure, Arsenal are below my expectations
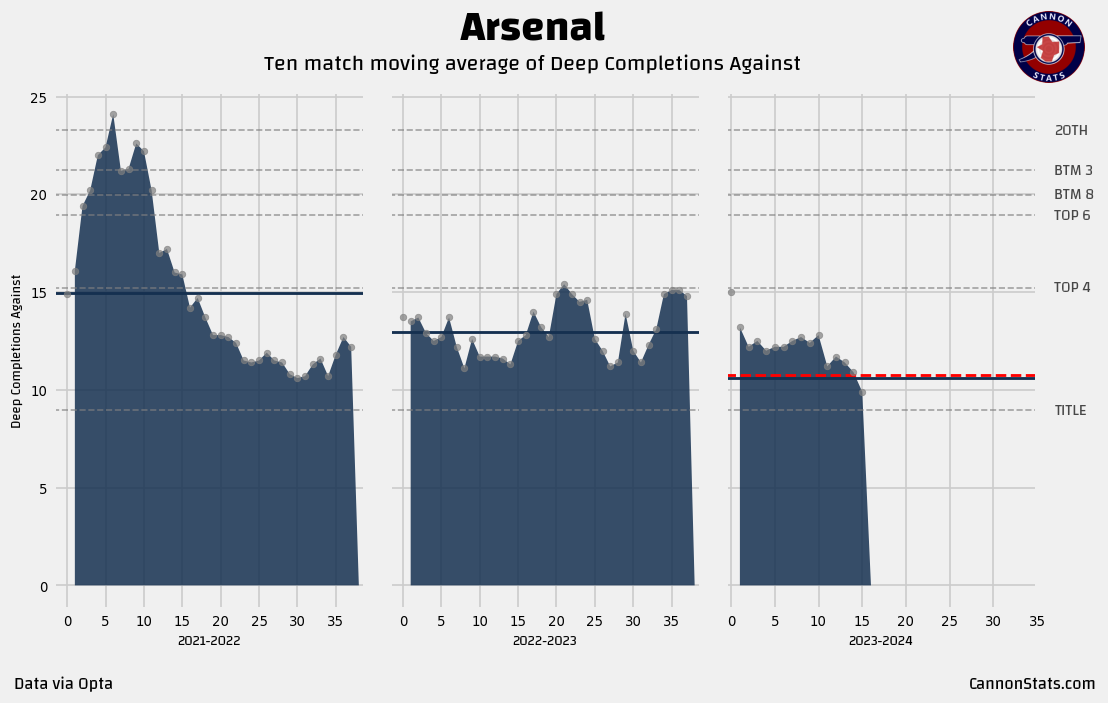
Deep Completions
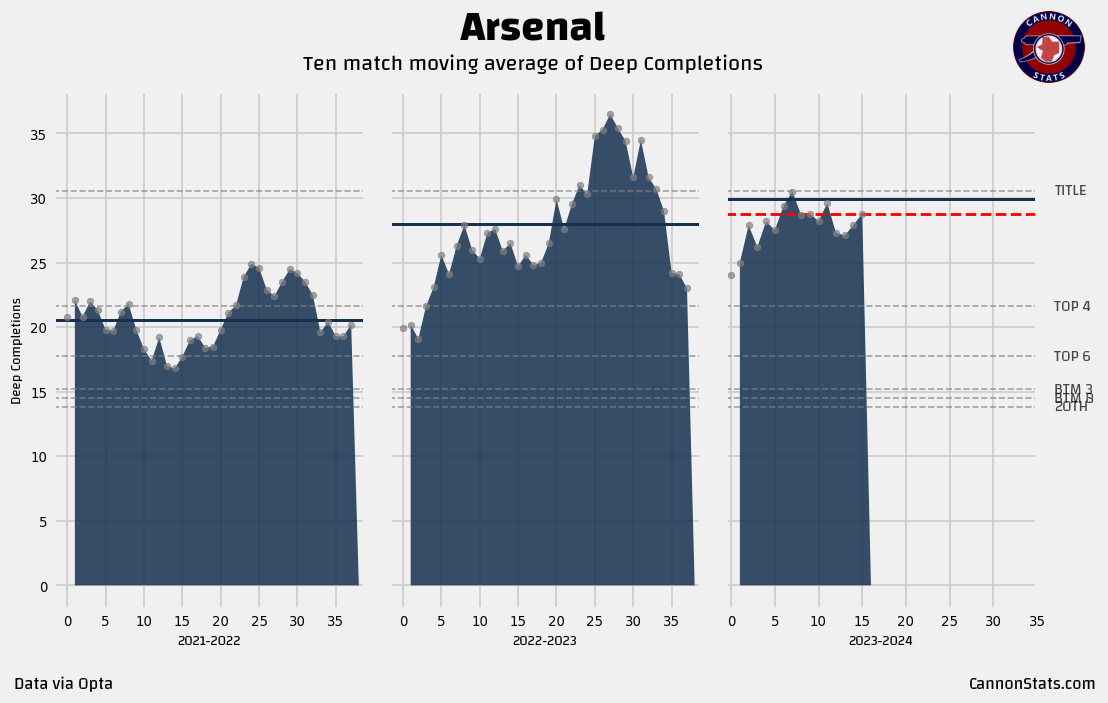
Getting and keeping teams away from dangerous locations is an indicator that I think is very helpful and a bit of a leading indicator if there is positive or negative things to come.
Arsenal are getting lots of dangerous possession, it just hasn’t resulted in the shots and goals that we would hope for. It is a similar story on defense, where Arsenal have done really well at limiting opponents from getting into those same spots.
↔️On this measure, Arsenal are meeting expectations
Field Tilt
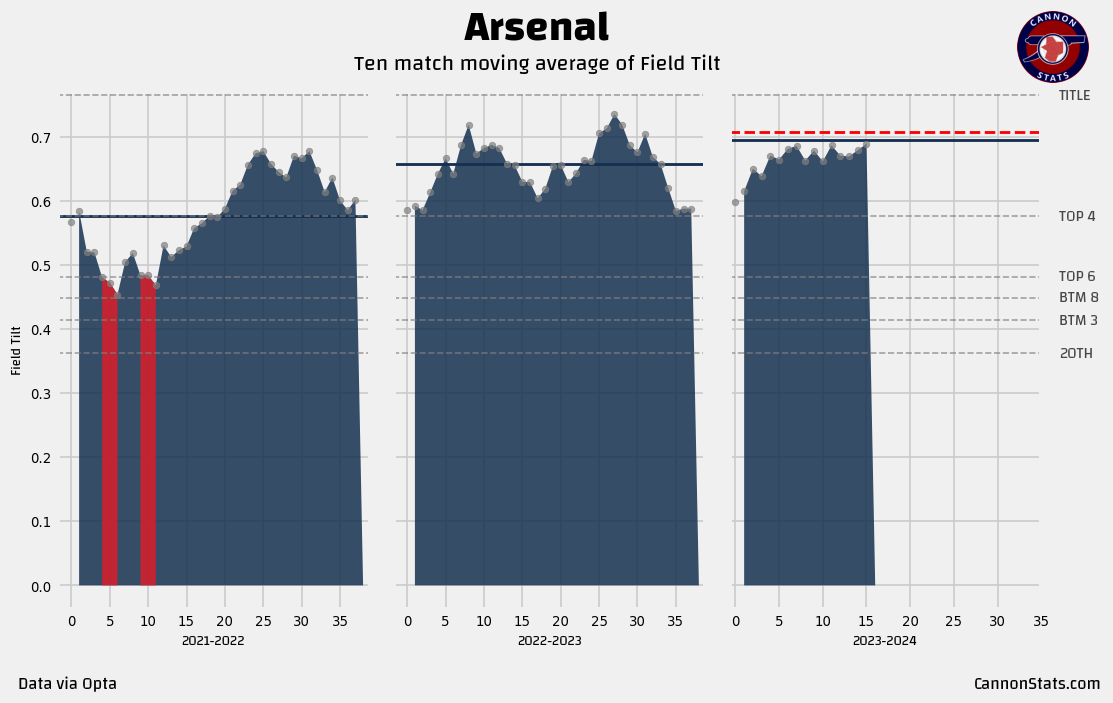
Arsenal is Field Tilt FC. It would be hard for a team to dominate the final third battle more than what Arsenal has done thus far.
↗️Overall Arsenal at my expectations
Overall
These metrics have expectations for Arsenal and they are meeting or exceeding expectations on 3 of them, with mixed results on 1, and below expectations on 1. That matches I think the general vibe for the team.
Things are going well but they are not perfect.
Arsenal have continued to look like they are legit title challengers, especially because Manchester City and Liverpool also look like they share question marks as well, with no team perfectly constructed and running away with things.
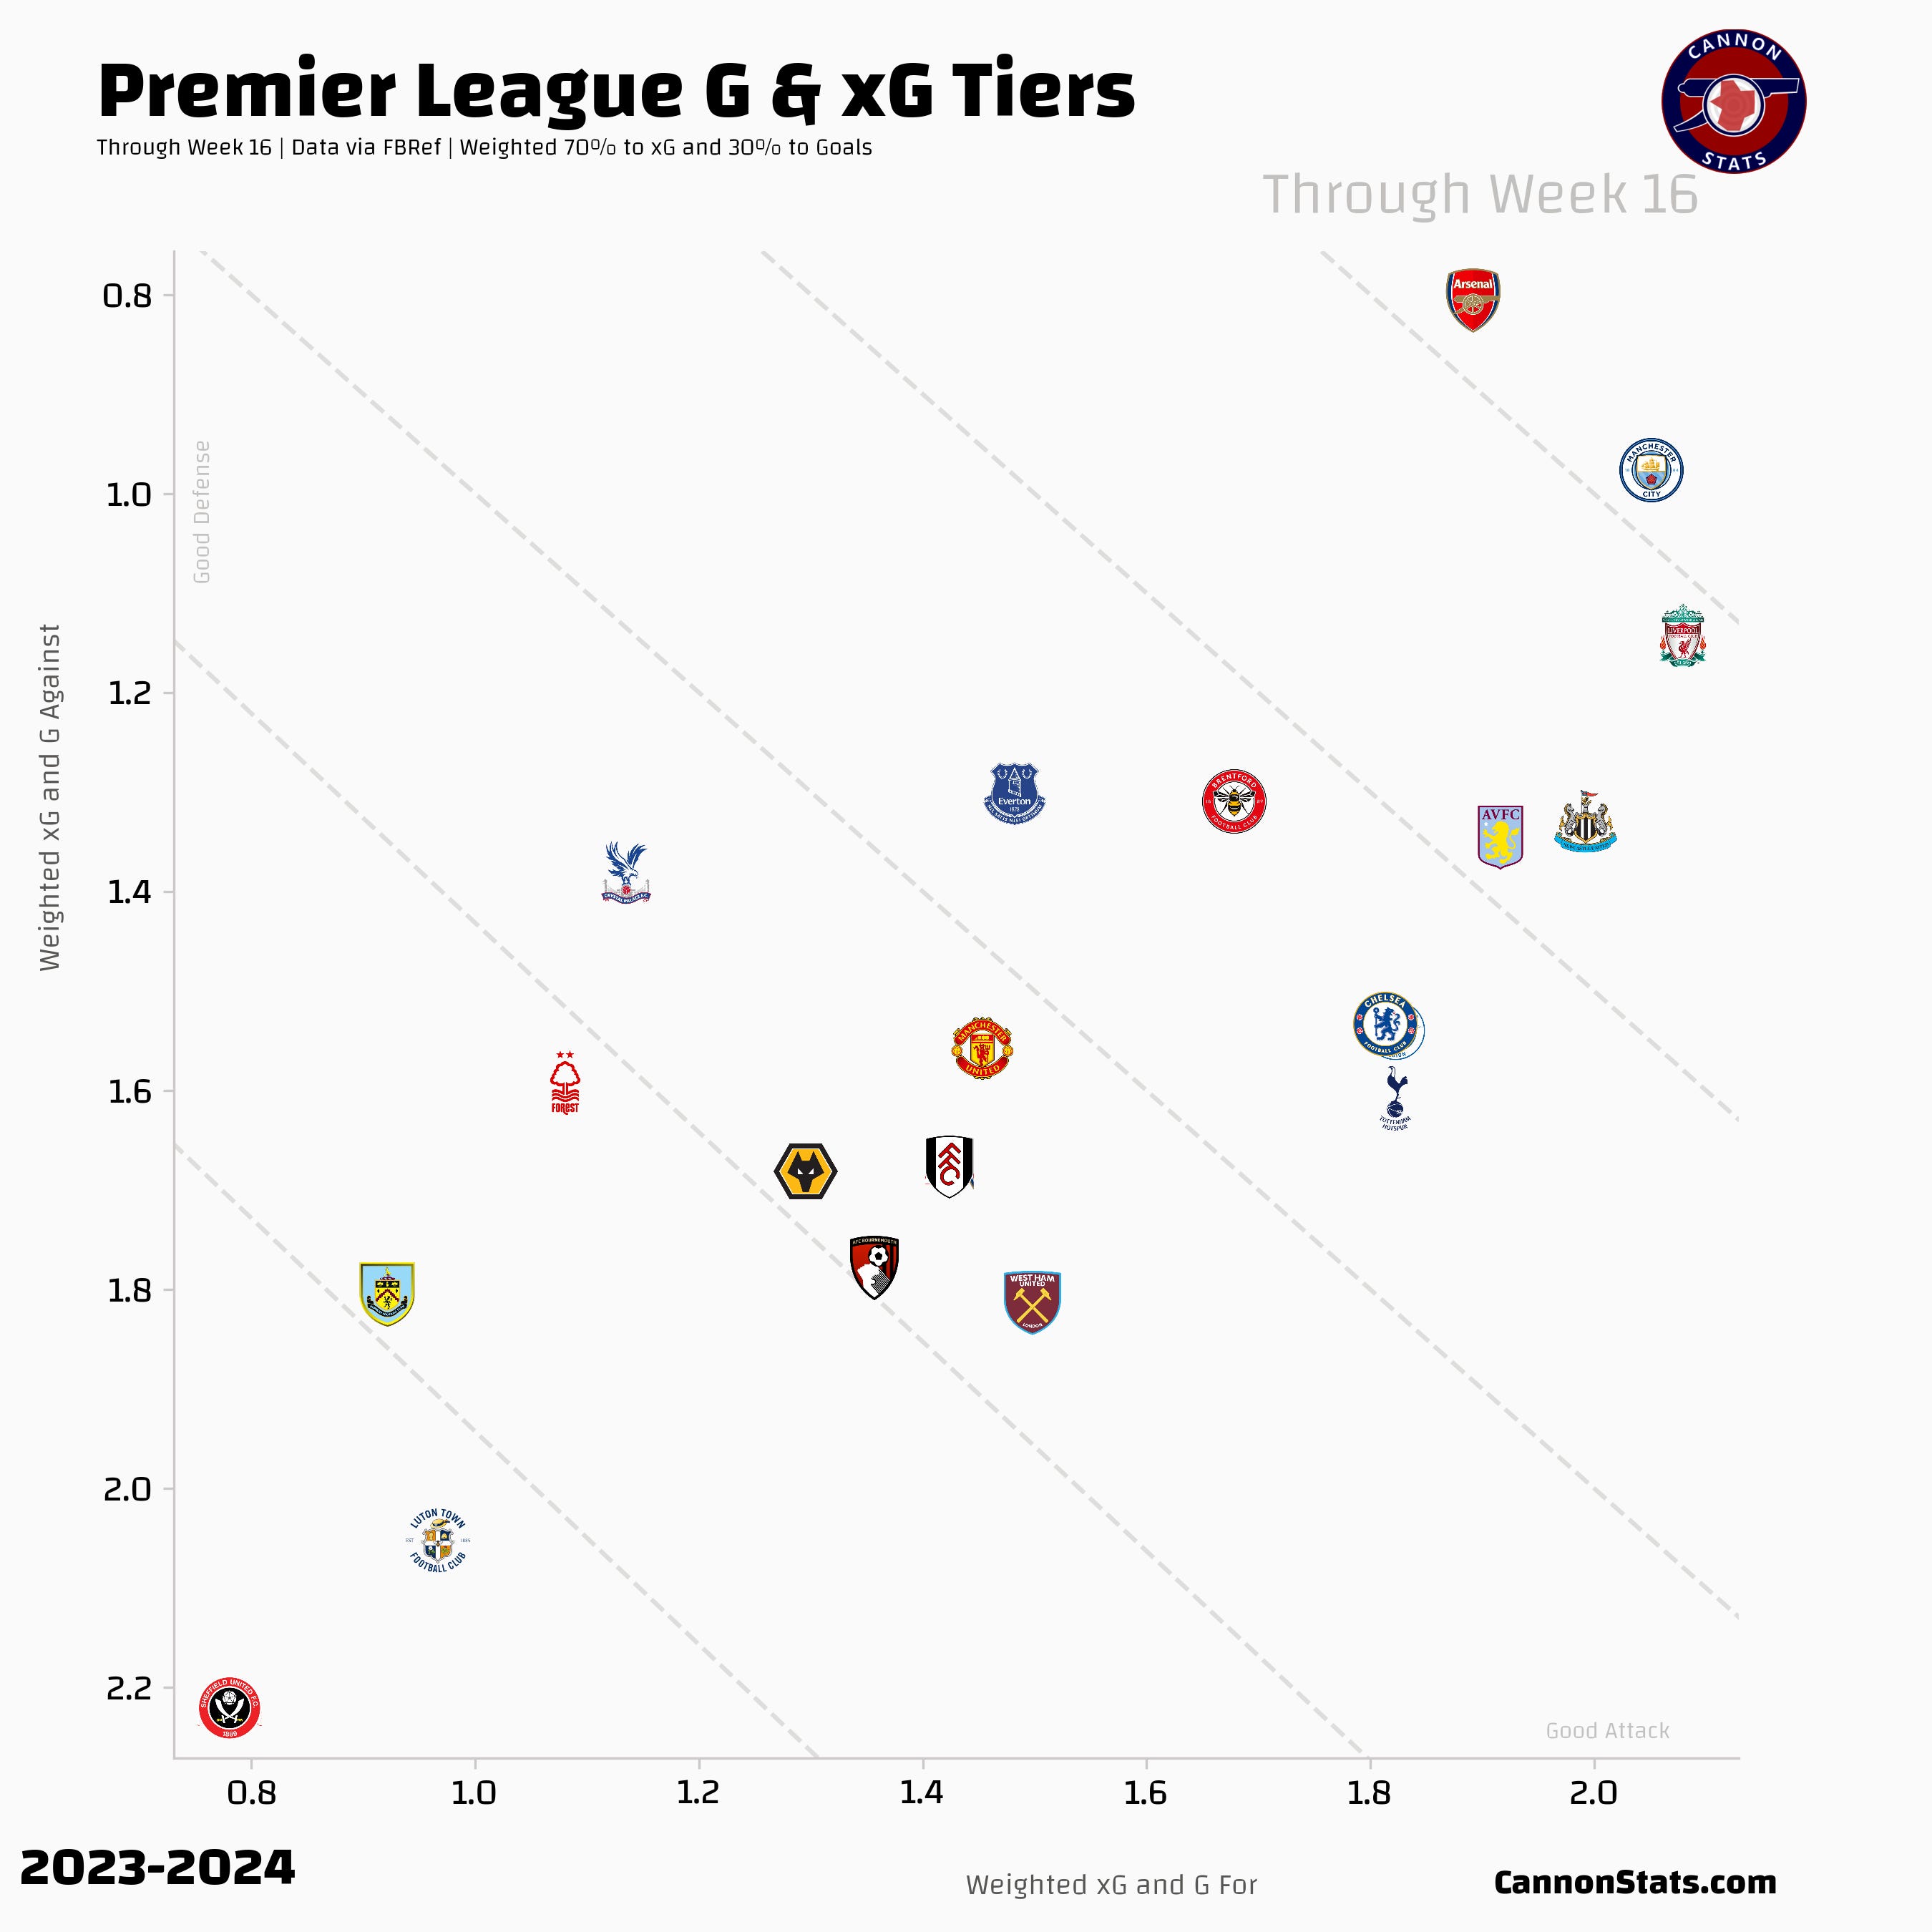
Looking at them on the weighted xG and Goals for and against, Arsenal are up in the upper right corner (aka the good corner) for the Premier League so far this season. The team has steadily climbed up the rankings, especially recently, with the results pushing them right into the thick of the title race. Arsenal have two matches coming up that will be huge for how things shake out for them.
Premier League Round 17 Odds
The weekend starts with a match today.
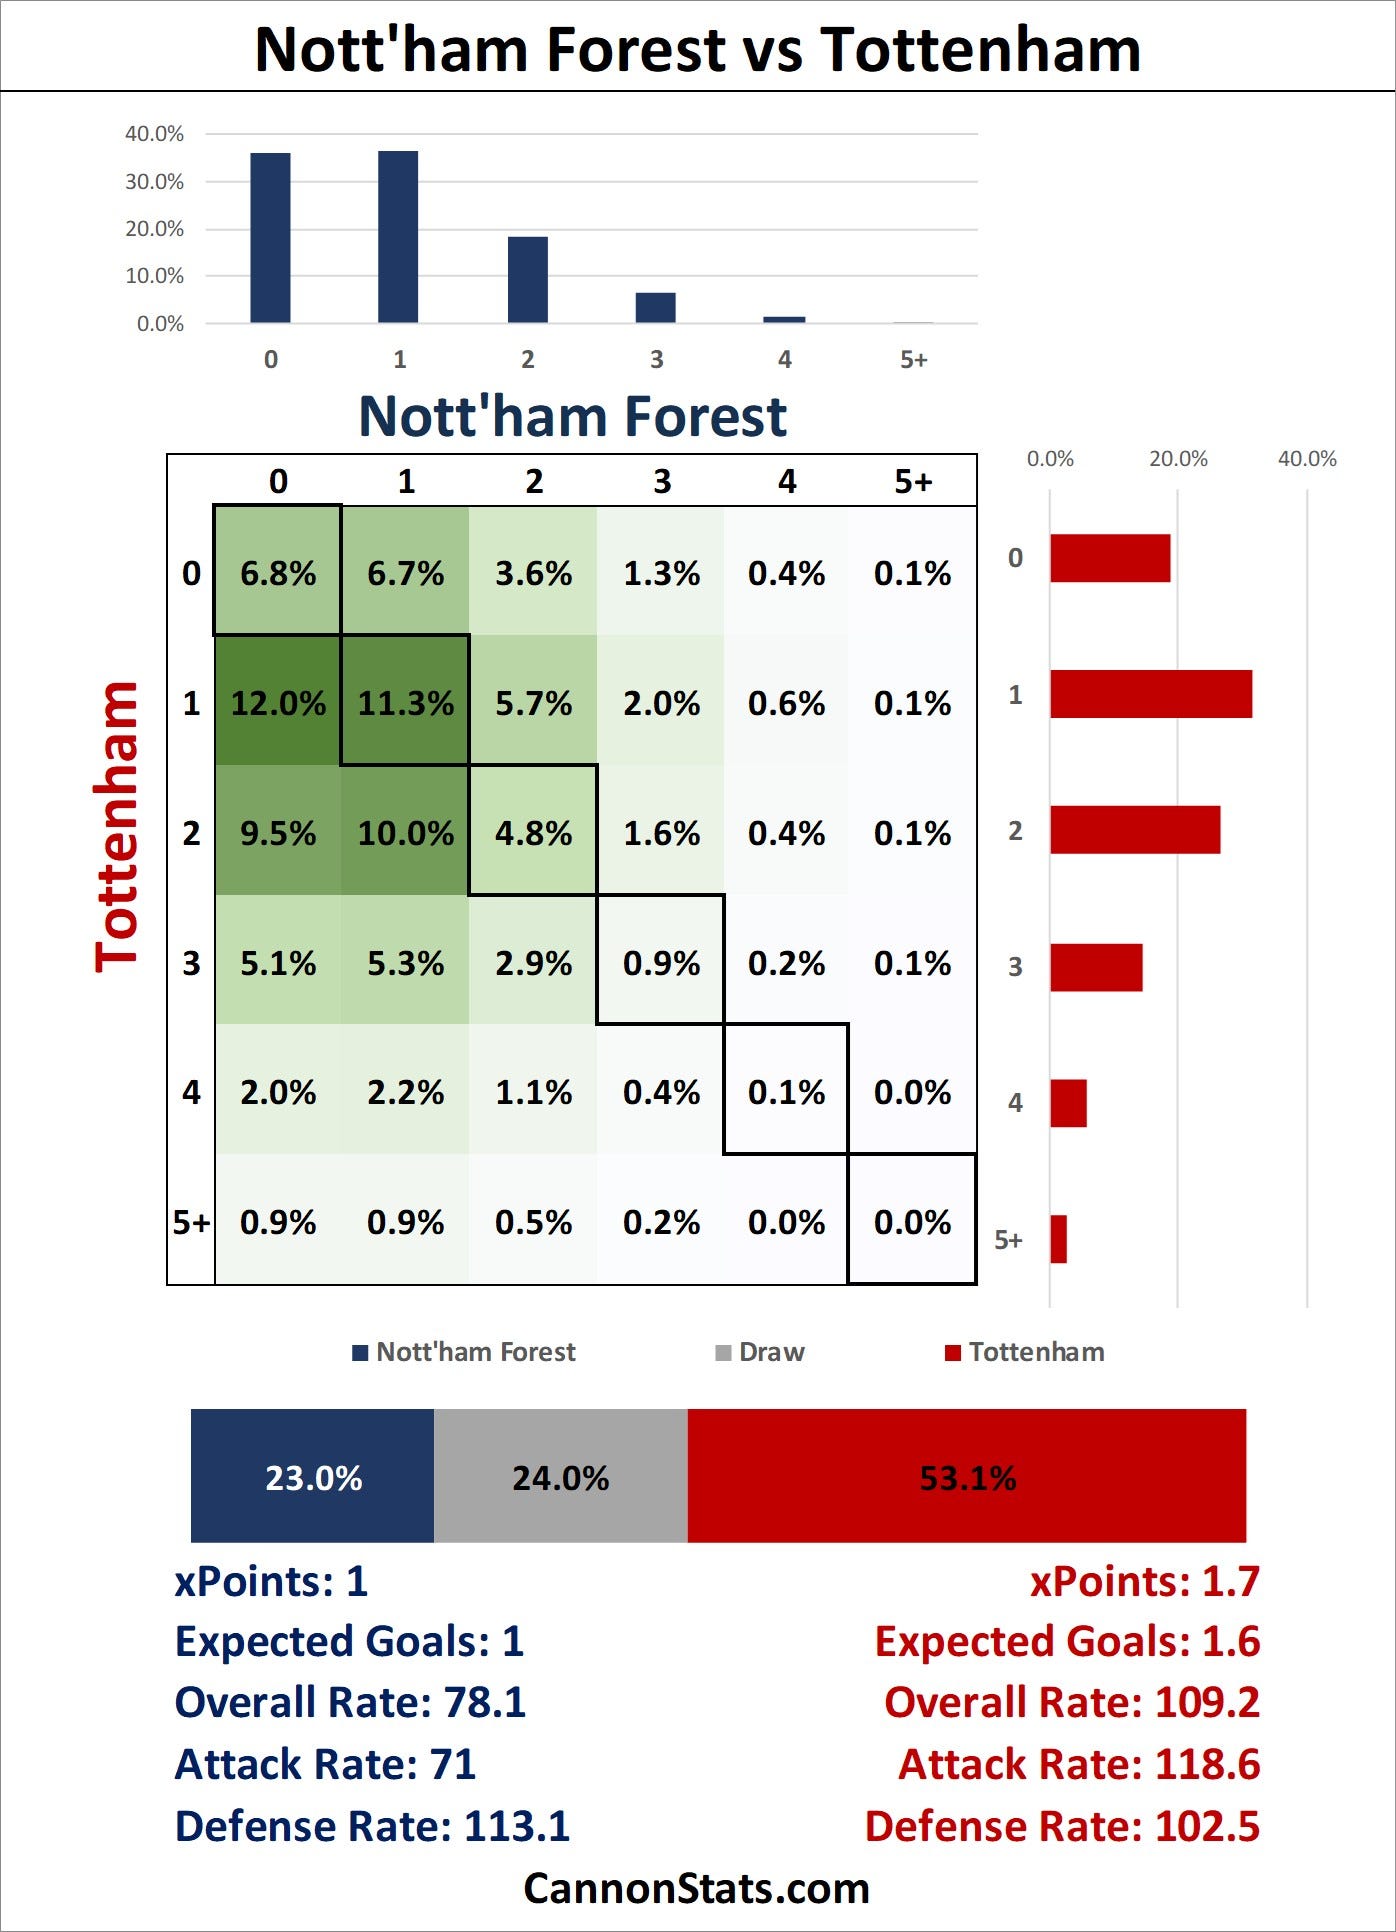
Tottenham are pretty heavy favorites here but this is still a tough road match. This will hopefully make for good Friday watching.
Because of the Friday match, we don’t have any early kickoff we go straight into the 7am kickoffs (3pm).


None of these matches looks especially close on paper, which isn’t too surprising for three of them involving the “big” teams. That the Bournemouth match is also this way says a lot about them and how they have improved this season.
The late match is the Dyche Derby.
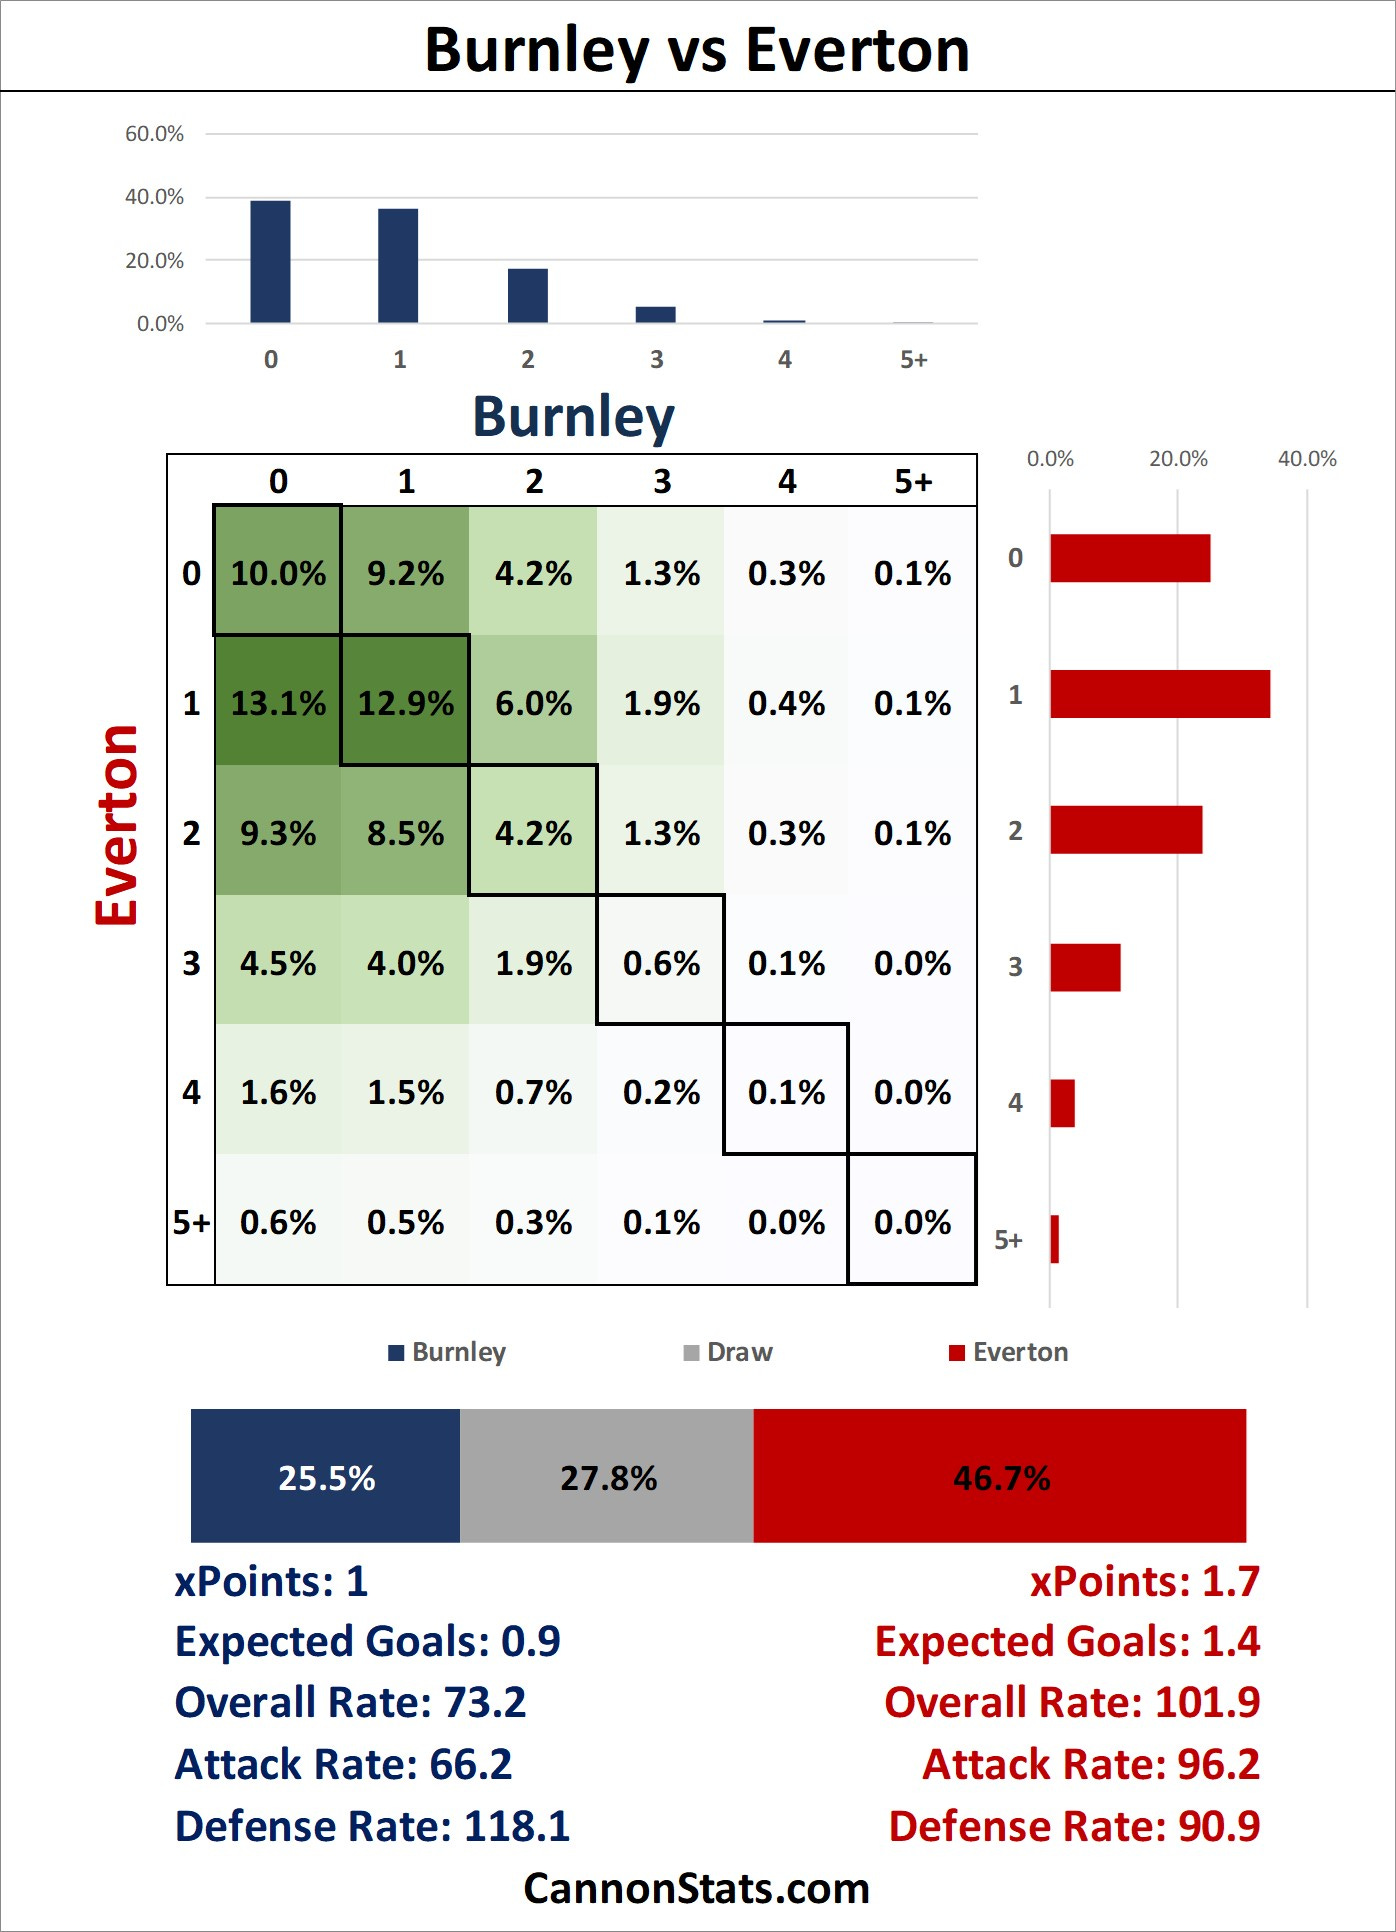
I expect Everton to get something here and work to solidify there position away from the relegation zone.
On to Sunday and we get Arsenal.
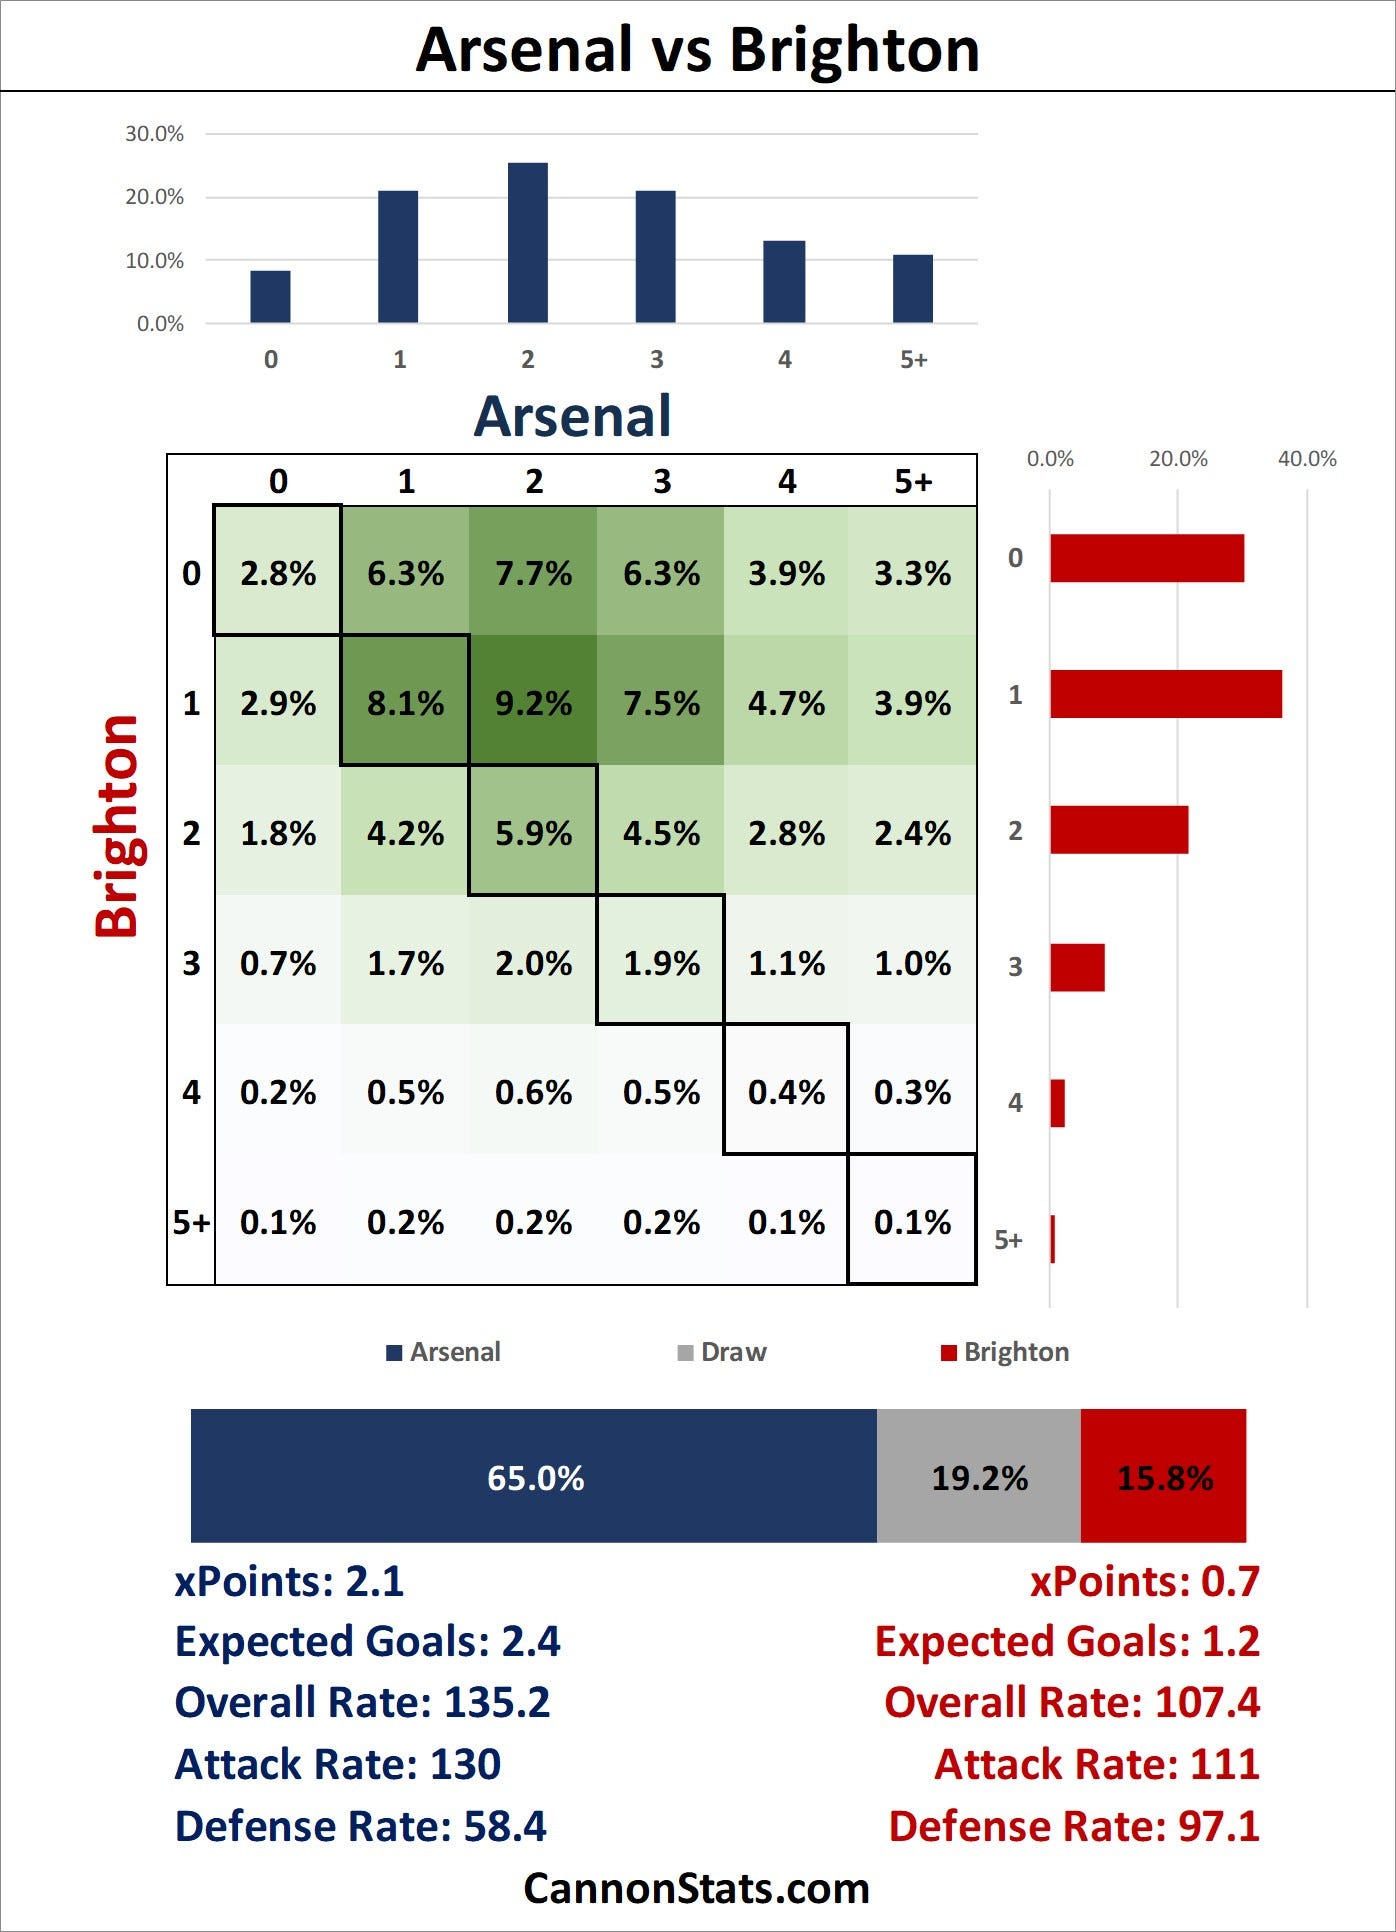
Arsenal come into this match with a couple of extra days of rest and had the benefit of being able to heavily rotate. Brighton had a must-win match against Marseille and had to play most of their non-hurt first-team options. That could tilt things in Arsenal’s favor even more if this match is close in the later stages.
This is also not nearly as good of a Brighton team as the one that gave Arsenal problems last year. The losses of Caicedo and Macallister have seemed to really hurt them as they have dropped from the 4th best team down towards 9th/10th.


The last match of the weekend is one of the first big ones that could knock ETH out of a job.

It is pretty wild to see how tilted this is to Liverpool, it is a sad state of affairs for Manchester United. Maybe they have some magic they can call upon in the old rivalry match to help Arsenal but I am not holding out hope.
Enjoy the weekend, I will be back Sunday with match coverage.
🤠 Yee Haw.
Thanks for a great article as always! Very small query - on the Brentford/Aston Villa graphic, it states that Villa are more likely to win (39% to 35%) but Brentford have a higher xPoints (1.5 to 1.3). Naively, I would have assumed that xPoints was calculated as xP = 3 * p(win) + p(draw), in which case Villa ought to have higher xPoints as well as the higher p(win). Is it possible the win percentages got swapped round by mistake in the graphic? Or are the xPoints calculated differently?