
Learning from all of Arsenal's draws in 2024/25
Arsenal's draws last season were the difference between second and a title. What caused them to have so many and what needs to change to fix that this season?

A draw isn’t losing but it is rightly described as dropping points.
For a team with title aspirations a draw is nearly as bad as losing and the difference in those two points is massive. You can feel this intuitively because when one of the title rival’s draws that feels like an opportunity to gain ground and not something that is a solid result (most of the time).
Arsenal lost just four times last season, that was the fewest losses of any team in the Premier League. That is also fewer than the team had in during the 2023/24 or 2022/23 seasons, but they still ended up winning 15 and 10 fewer points than those seasons even though they managed to be harder to beat. The four losses were the same as Liverpool had who won the League and the difference between the team was that Liverpool was able to convert those potential draws into wins, while this last season Arsenal couldn’t.
The dropped points in the matches where the points were shared made the difference.
This is typical of the Premier League Champions, the average team that has won the Premier League has had just 7 draws over the course of the season.
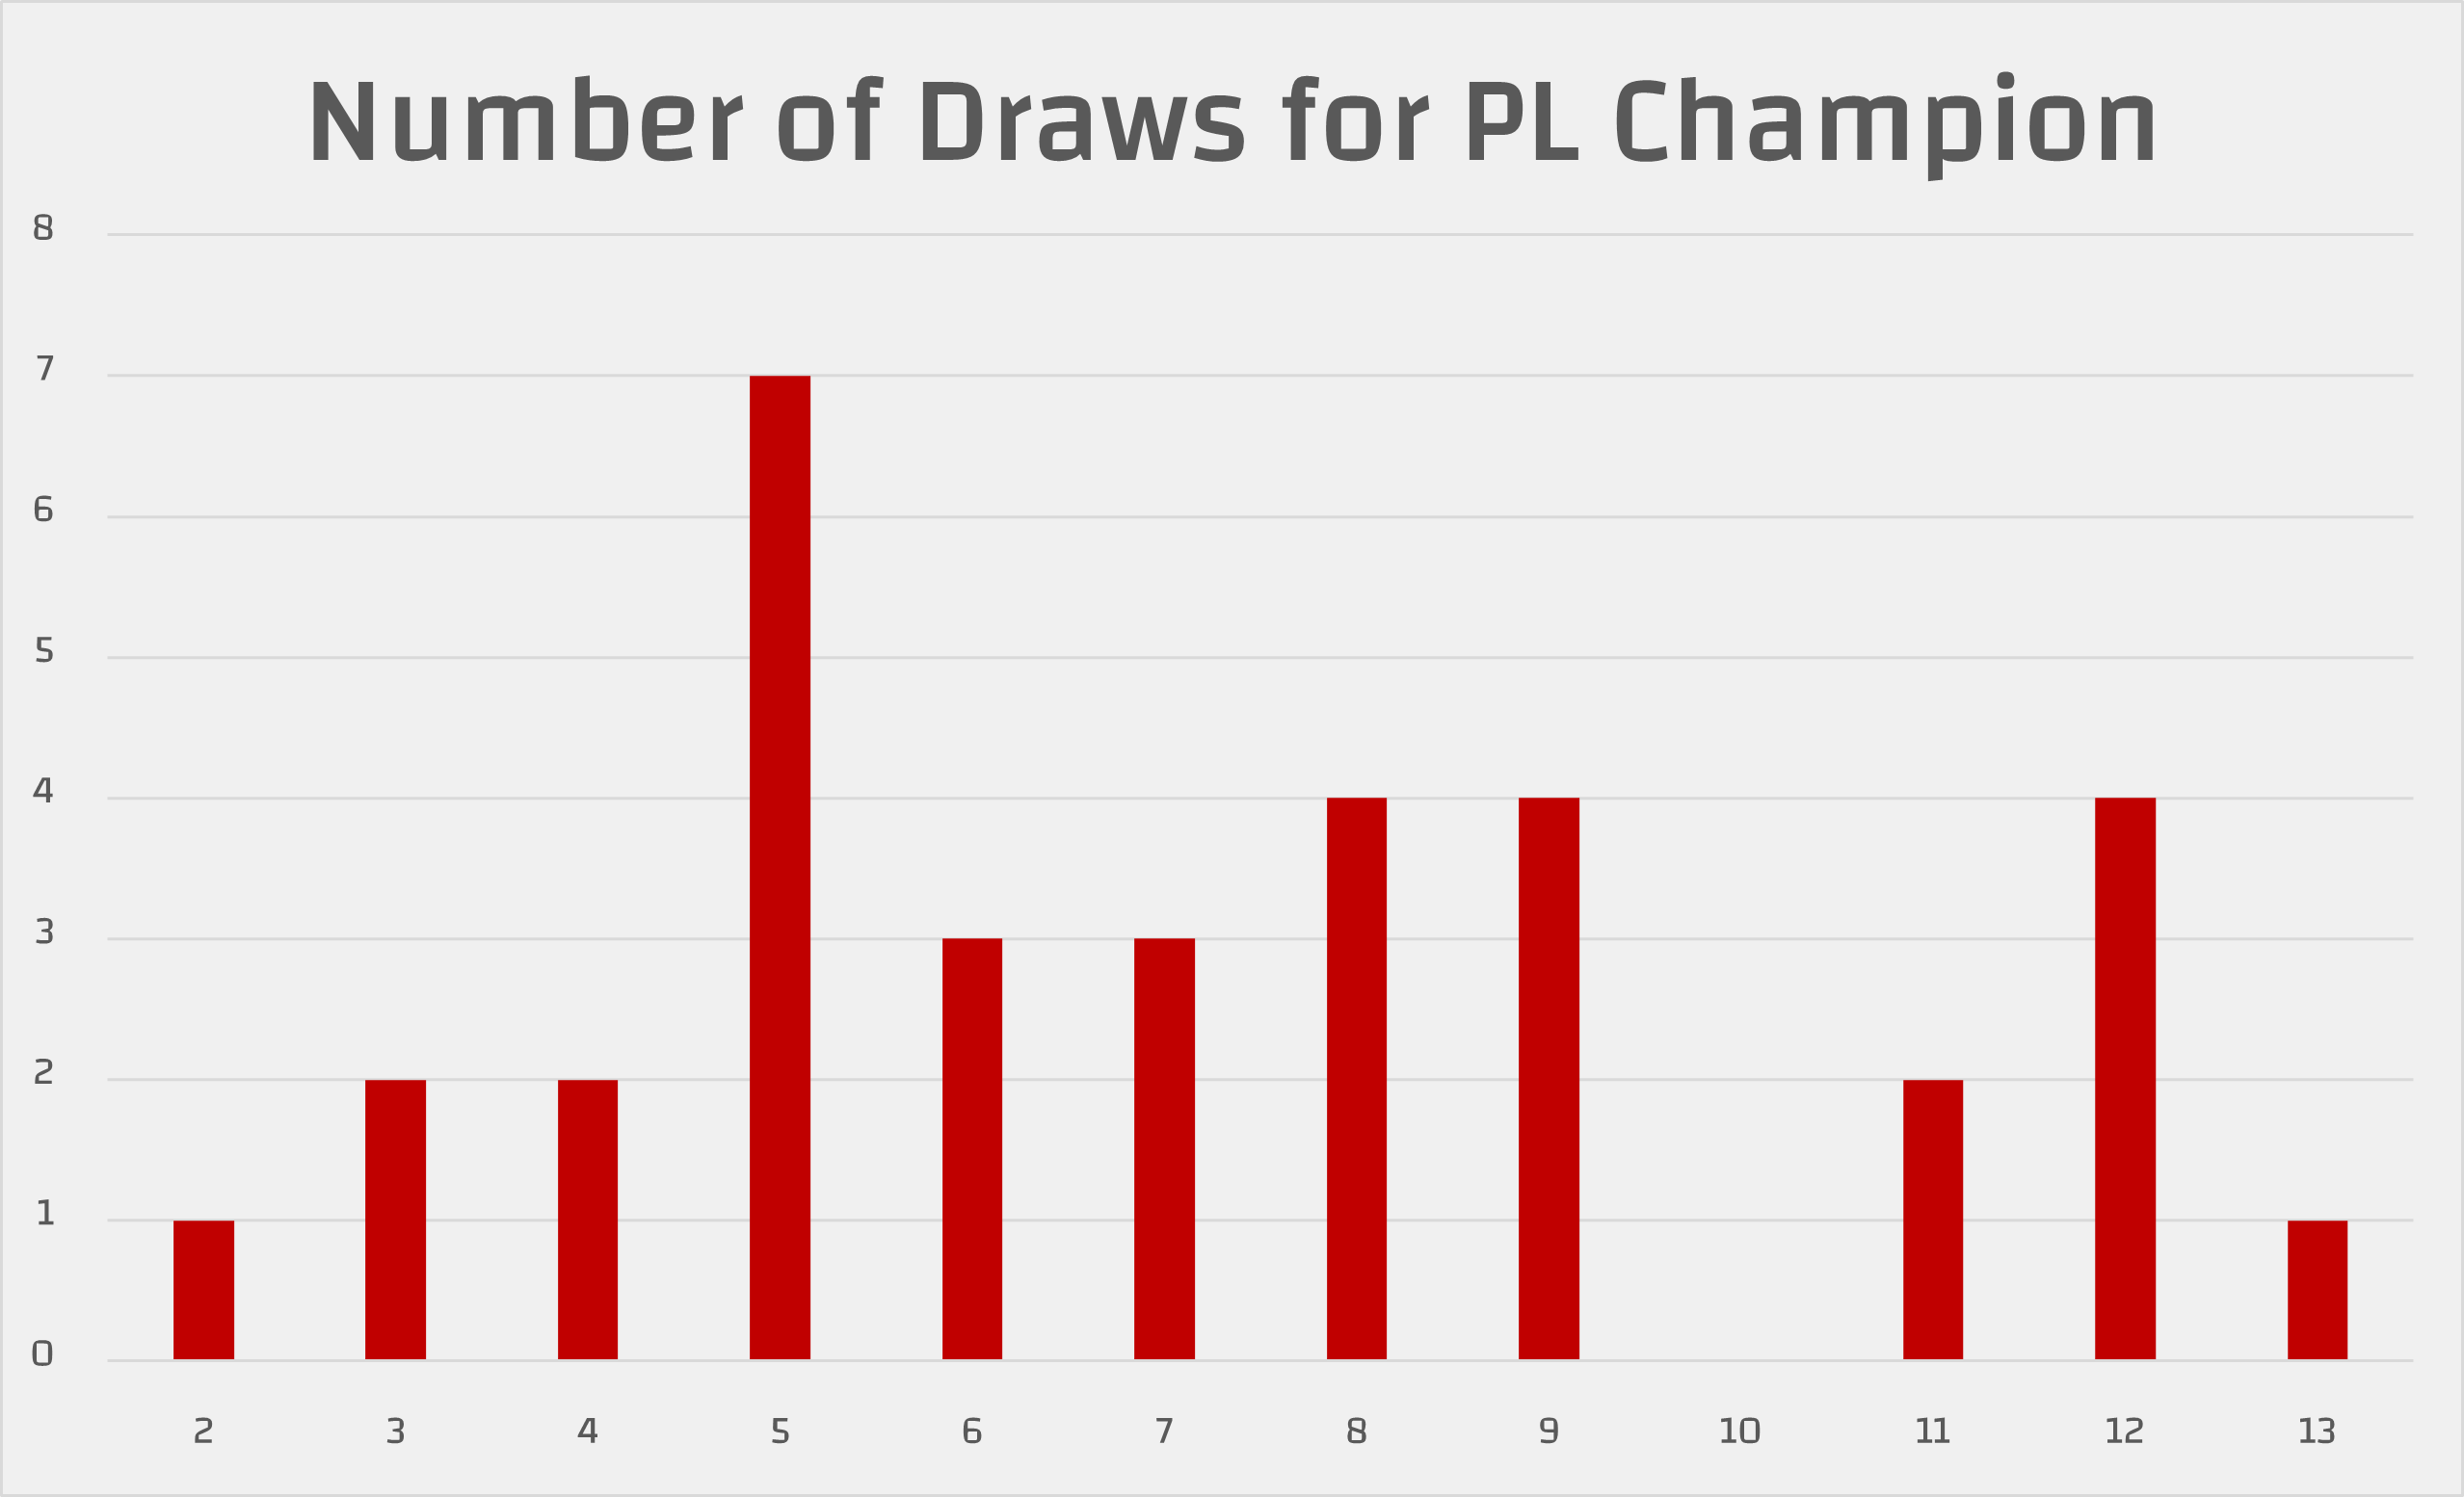
This has become even more the case in the recent era where the Champions have pushed the points totals into the high 80’s or even more. Liverpool’s 9 draws last season were an outlier in recent times and goes to a bit why they only won 84 points this season which is the lowest winning tally since Leicester in 2015/16 (who also had 12 draws). In the eight seasons from 2023/24 to 2016/17 the winners have averaged 93.6 points and just 4.4 draws, with no team drawing more than 7 times.
The Champions will lose (well all except for one team that is) but almost without exception they will turn the marginal matches that could be just one point into three. With the competition as stiff as ever for the coming season there is little reason to expect that this trend will subside.
This last season, 9 out of Arsenal’s 14 draws came after they had taken the lead in the match (two of these also came in matches where there was 40+ minutes of 10v11 because of a red card and given the distorting nature of red cards these will be left out of the analysis).
Among the Champions League teams this season Arsenal had by far the lowest rate of turning leads into three points, with the other four team’s converting nearly 80% of their leads into wins while Arsenal had a rate that was barely above the league average of 65.2%.
The big issue with Arsenal this last season was that the team struggled to add on when they took the lead. Overall compared to peers they were just pretty good in this +1 winning game state.
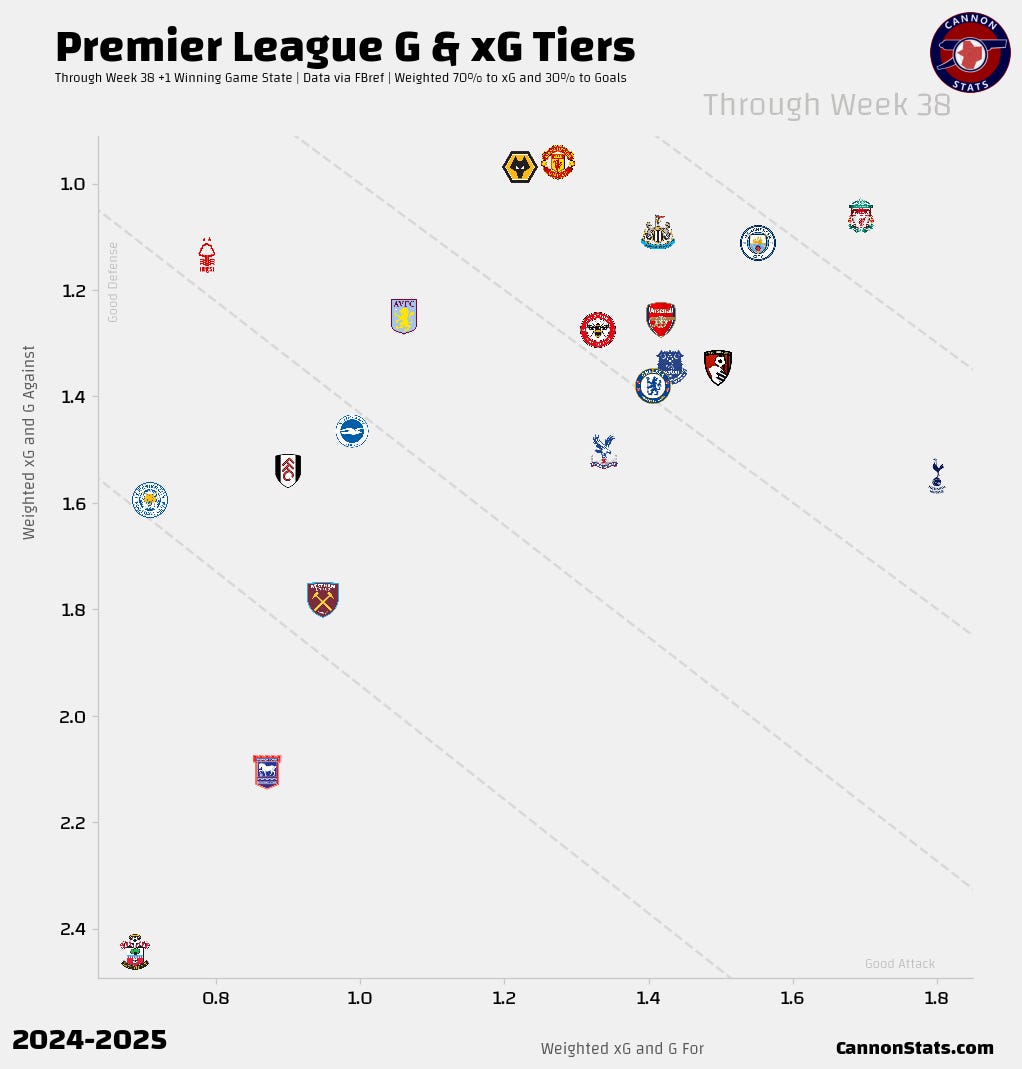
Arsenal ranked 6th for xG created and 8th for goals scored while winning by one goal last season. Defensively they ranked just 4th for xG allowed and a bit concerningly, they ranked 11th for goals allowed while winning by one goal last season. Looking exclusively at goals shows this shortcoming quite starkly.
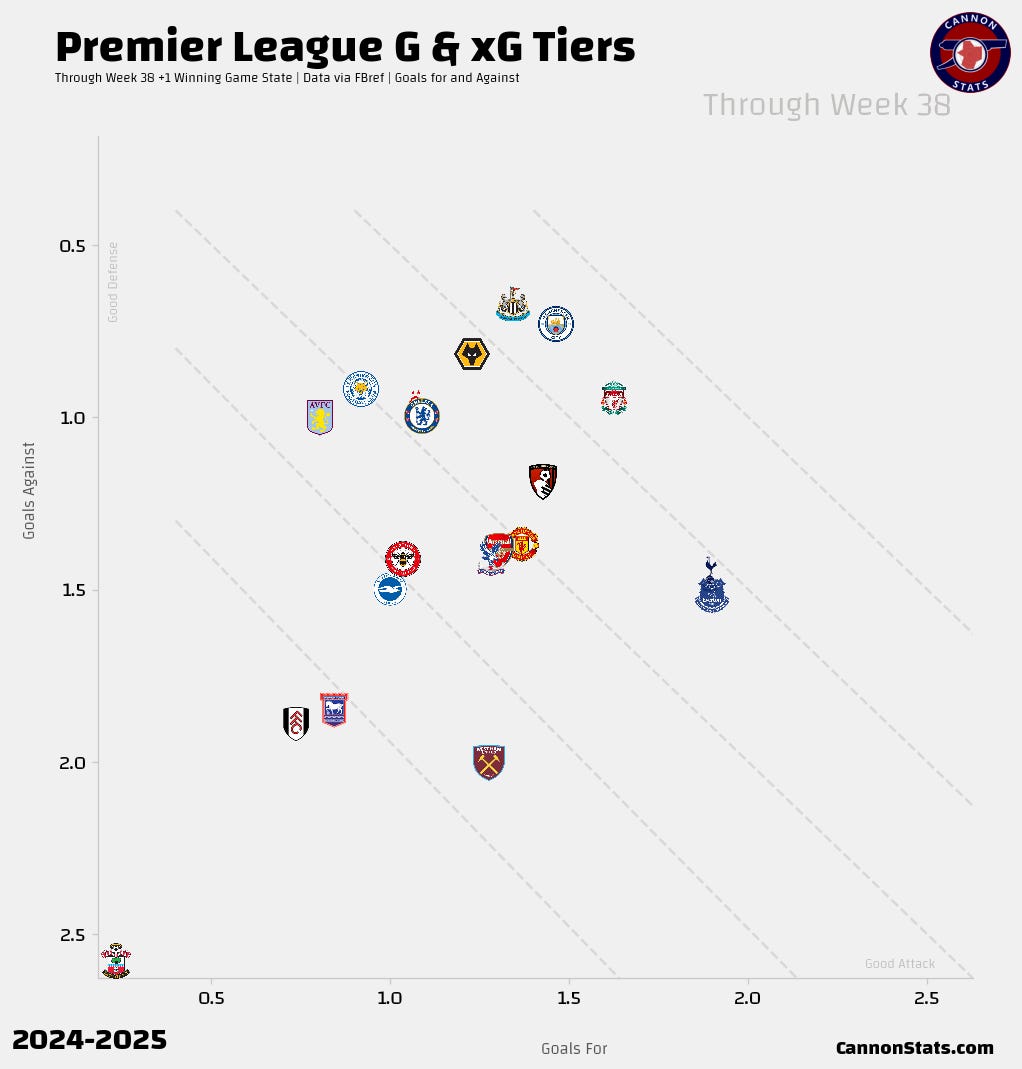
Some of what we are seeing here with just the goals scored and conceded, was almost certainly some bad “luck” with more goals allowed than xG allowed but the overall performances are still something to dig much further into to understand.
Two of Arsenal’s draws this season were with a nil-nil scoreline, where the game state never changed and the final four draws this season had the team recovering a point from a losing position1.
A quick related aside that I want to highlight before we come back to draws, there without fail an outpouring of dread when Arsenal go down in a match, with the feeling that the team won’t be and has rarely been able to recover back. The numbers overall for these situations compared to peers and the league average suggest that is perhaps a bit misplaced.
First, Arsenal under Mikel Arteta have just not been a team that falls behind in matches. Over the last three seasons they have faced a deficit just 33 times in 114 matches. That is the fewest of any team (Man City have 39, Liverpool 53) over that span and that was the same last season where Arsenal fell behind just 11 times last season.
Secondly, the team has been quite adept at recovering points from these tough losing situations. Last season they were able to earn at least a point in 8/11 matches from losing positions (the second highest rate in the League) and this ability has held over the last three seasons where they have converted the 33 deficits into points 18 times, earning 1.2 points per time going behind compared to the league average of 0.72.
While falling behind in matches is never good for maximizing points, this was not the problem for Arsenal last season and their total number of draws. The team should continue to avoid falling behind but the overall approach when losing does not show it’s self as an issue that should be a concern.
Let’s dig deeper into how things looked in those matches where Arsenal drew.
Arsenal’s draws in context
A good place to start here with this analysis will be looking at the high level and compared to the matches Arsenal won or lost to see if there are any major things that jump out at us.
These stats exclude the red card matches against Brighton and Manchester City.
The first thing that is obvious is that for a draw is that the attacking numbers are not as good as when the team wins. This is not a surprising outcome, but the difference is clear.
Shots drop from 16.2 to 13.1
xG drops from 1.9 to 1.4
Open Play key passes drop from 10.2 to 8.1
This drop off in attacking numbers is exacerbated in the drop off in finishing. In matches that Arsenal won last season they scored 2.5 goals per match from 1.9 xG (2.1 post shot xG) and 5.8 shots on target compared to 1.2 goals per match from 1.4 xG (1.3 post shot xG) and 3.9 shots on target in the matches that they drew.
Some of this tautological, where goals scored/finishing is the explanatory factor for why a team will draw but there is still an issue here where the attack was not nearly as good. The team lost a shot from fast break/transition play in their draws compared to wins, and two shots from general open play patterns while being able to generate roughly the same number of chances from set plays.
On the defensive side of the ball the performances are not drastically different between winning and drawing.
Shots allowed are slightly lower when points are shared with 8.3 compared to 8.6
xG allowed is solid regardless but a bit worse when drawing at 1.1 compared to 0.8 when the team wins
Transition defense is a bit worse when Arsenal draw, going from 2.3 shots per match to 2.0 for direct/fast break shots allowed
Teams against Arsenal in the matches where they drew or lost don’t have anything special with the finishing or lack thereof when they drew or lost either, 1.2 goals on 1.1 post shot xG in the draws compared to 0.6 goals scored on 0.6 post shot xG in the matches Arsenal won.
Looking at the stats that measure style/tactics, the numbers remain very consistent regardless of the result with the differences looking quite marginal between when the team wins and draws.
In Arsenal wins, they have a bit less possession at 54% compared to 60% in draws, they played at roughly the same direct speed towards goal (1.9 yards forward per second in possession while winning compared to 2.0 yards forward per second in possession while drawing) and had the same number of passes per possession at 8.5 vs 9.0
Arsenal have more field tilt when they win with 71% compared to 67% in draws but have more total final third pass attempts (more possession) when they draw.
The share of where the game is played between the defensive, middle, and attacking third is basically the same between wins and draws.
The mix of pass types attempted, and completion rates are very similar regardless of result.
In matches where Arsenal win, they have a slightly higher passes allowed per defense action (PPDA is a measure of pressing, a higher number here corresponds with less pressing and the opposition being able to complete passes easier without disruption) at 10.1 compared to draws at 8.9 but they have on average a higher average defensive action (sometimes shown as line height on visualizations) at 32.2 yards when winning vs 29.9 yards when drawing.
I don’t think that this is particularly paradigm shifting information if you watched Arsenal last season, the style and tactics didn’t drastically change most weeks and that held when winning or drawing. What did seem to show in this aggregate data was that the effectiveness and execution did vary and that led to the different results.
On the execution/efficiency front Arsenal had the ball in the final third a bit less in the matches that they won, but the touches that they did generate turned into more and higher quality shots (that they also finished at a higher rate).
Now that we have taken a higher-level aggregate view lets go into detail for the different matches that Arsenal drew this season.
Arsenal draws in detail:
Arsenal 2-2 Liverpool
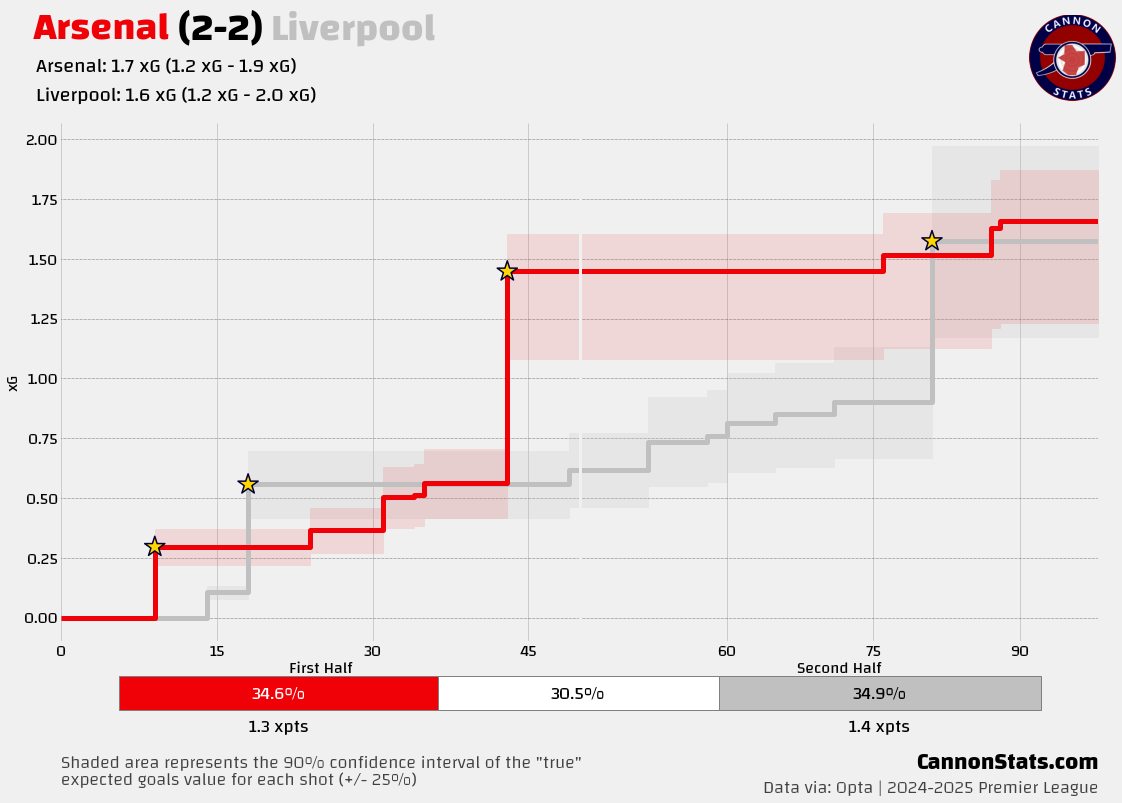
In this match, Arsenal took the lead twice and were pegged back to even twice. Arsenal were leading for a total of 49 minutes and in those minutes over the two periods managed just 1 shot.
Arsenal dominated proceedings at an even game state here, Arsenal had 60% possession, 23 to 9 on touches in the box, 8 to 0 on shots and 1.6 xG to 0.
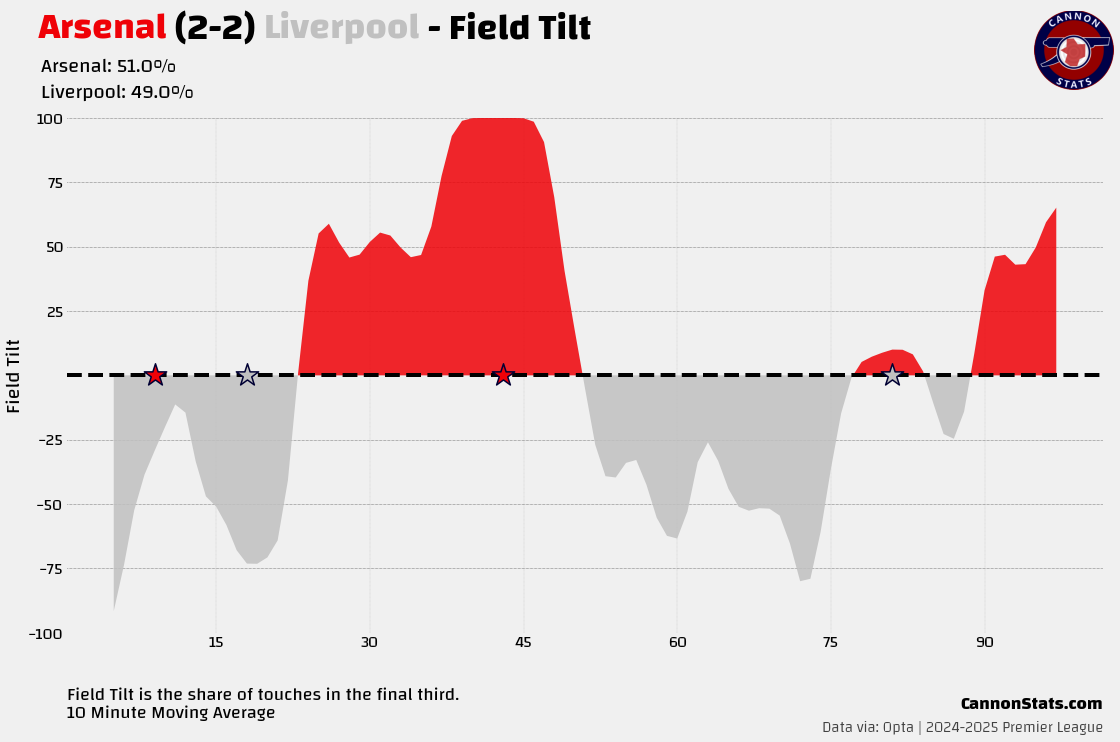
With Arsenal winning things flipped, Arsenal had just 28% possession, 9 touches in the box to 18, 1 shot to 9 and 0.07 xG to 1.6.
Liverpool are a very good team so it’s not quite simple enough to say that Arsenal should have maintained that same level of play/dominance while up. This criticism is something that has been levied at Mikel Arteta with Arsenal in the past, if Arsenal go up a goal they can be too willing to cede the initiative and get passive with regards to pushing for a second goal.
This particular match is a situation where the draw wasn’t the worst result all things considered. Given the starting context you can understand the perspective to play more to protect the lead it in this specific match. With the team coming into the match with a makeshift backline that didn’t have William Saliba (suspended for a red card against Bournemouth) and was playing Thomas Partey at right back, protecting and not pushing against the lethal transition attack of Liverpool was a defensible decision.
The situation in the second half pushed the calculus even further in that direction for Arsenal due to forced substitutions, Gabriel was replaced by Jakub Kiwior due to injury in the 54th minute and then Jurrien Timber was replaced due to injury by Myles Lewis-Skelly (before he became fixture of the starting lineup and still looked like a teenager playing his first Premier League minutes) in the 76th minute.
After the Liverpool equalizer for the second time, Arsenal do get a bit more of the ball again, but they couldn’t really put the overwhelming squeeze to force a winner.
We can’t also fail to note that Arsenal had the ball in the back of the net with what could have/should have been the match winner, it was waived off after a late whistle for a foul in the buildup to a goal being scored.
Chelsea 1-1 Arsenal
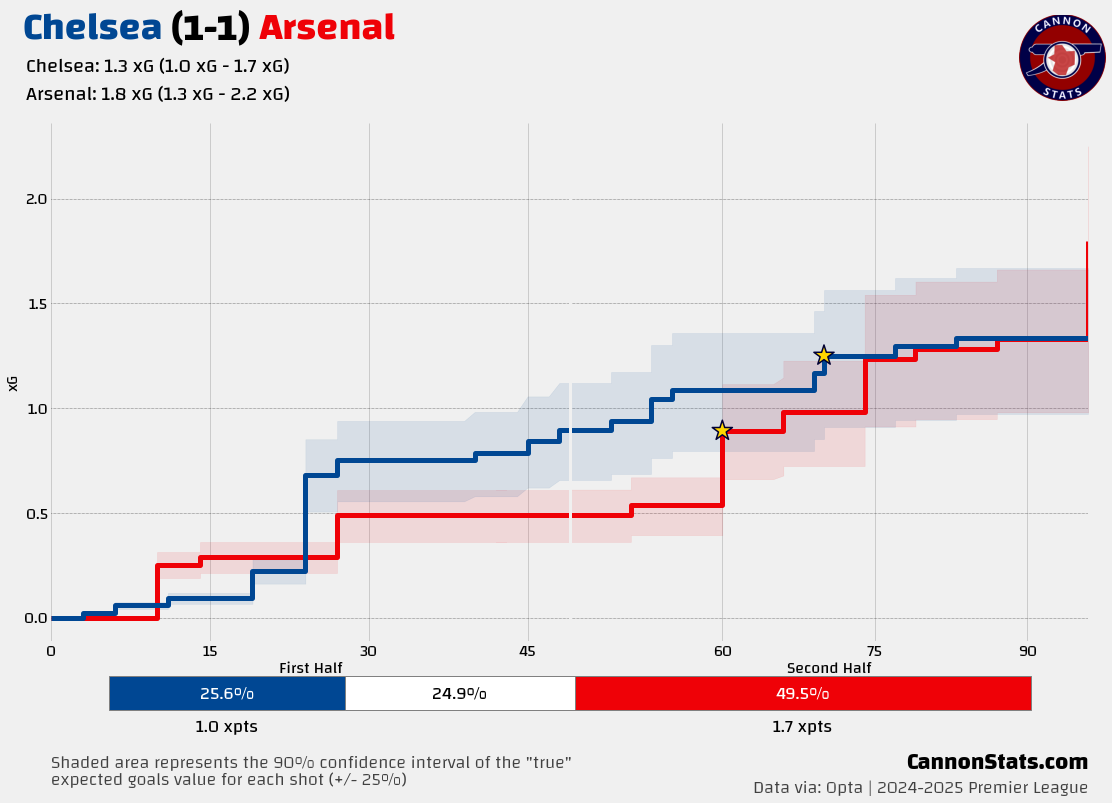
This is another match where Arsenal dropped points from a winning position, but the time spent winning was just 10 minutes here.
The overall story of this game is pretty different to the Liverpool one, Chelsea were more in the game and in the first period before Arsenal scored, they had the better chances to go ahead.
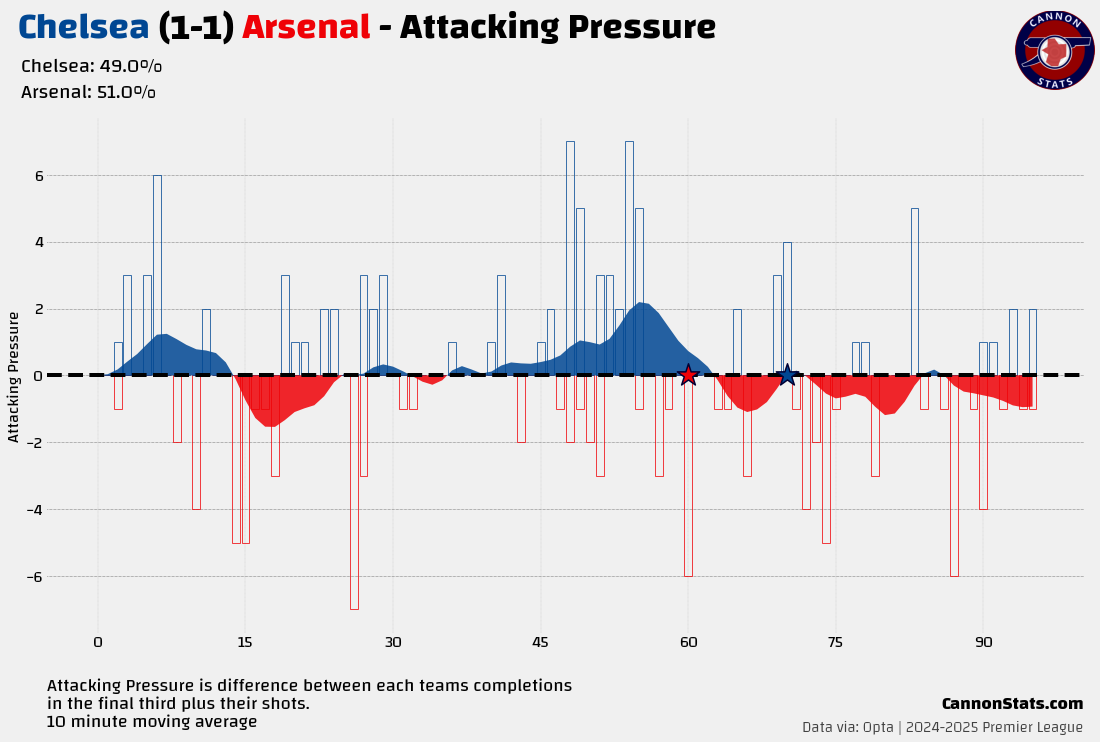
It was just 10 minutes leading, but the trend was similar with the change in the high-level numbers after the goal; with possession switching from favoring Arsenal but close to Arsenal having just 14 pass attempts to 55 from Chelsea and the field tilt also switching to Chelsea (the game was back and forth here overall).
The timeframe here is not enough to get a clear picture but again it could be a time where Arsenal go up in a match and are too comfortable to try and let the defense see them out.
After Chelsea evened it up, things remain pretty even but Arsenal do manage one late chance that fell to Leandro Trossard that he failed to get on target and the points ended up shared.
Fulham 1-1 Arsenal
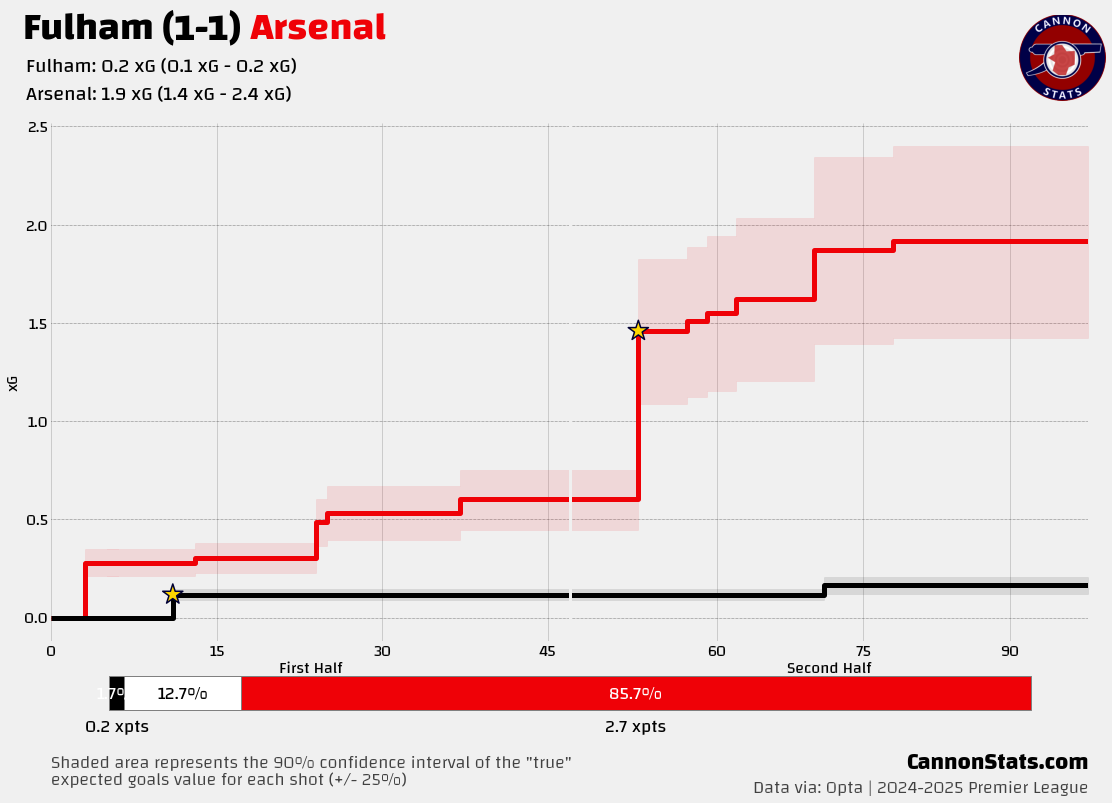
This is our first match where Arsenal came back from a losing position to earn a point.
It is positive that the team was able to come back here but one of the things from this match that sticks out is that after the 75th minute, the team manages just one low quality shot as they are looking to turn this into three points.
There are a few of these type games that follow this pattern overall this last season; Arsenal’s performance is good enough to win, even if you could nit-pick about how the attack kind of fizzled out in the final few minutes but things did not bounce there way with the goals and result.
This is never a perfect reflection of all of the potential outcomes because actual goals scored change how teams play after they happen but taking just the chances for both teams in this match and running them through a simulation to see the spread of potential results you get the following.
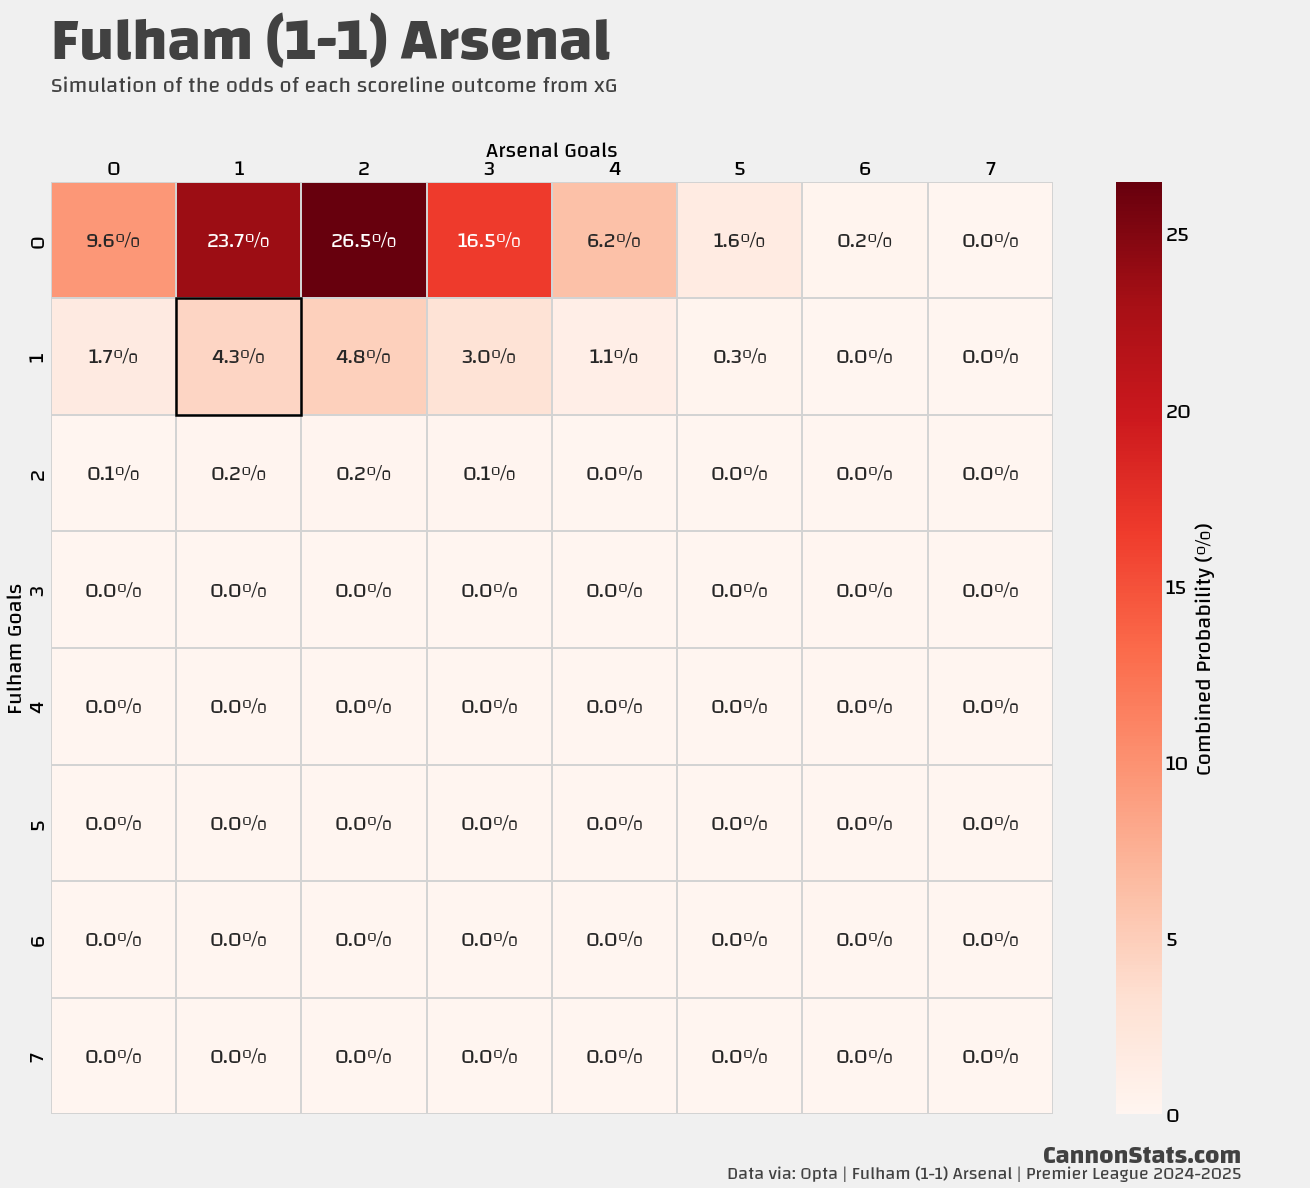
Arsenal putting up a big scoreline and win were more likely outcomes than the actual 1-1 result that happened in real life. Over the course of season, these “footballings” will happen, a team just has to try to create enough to overcome them.
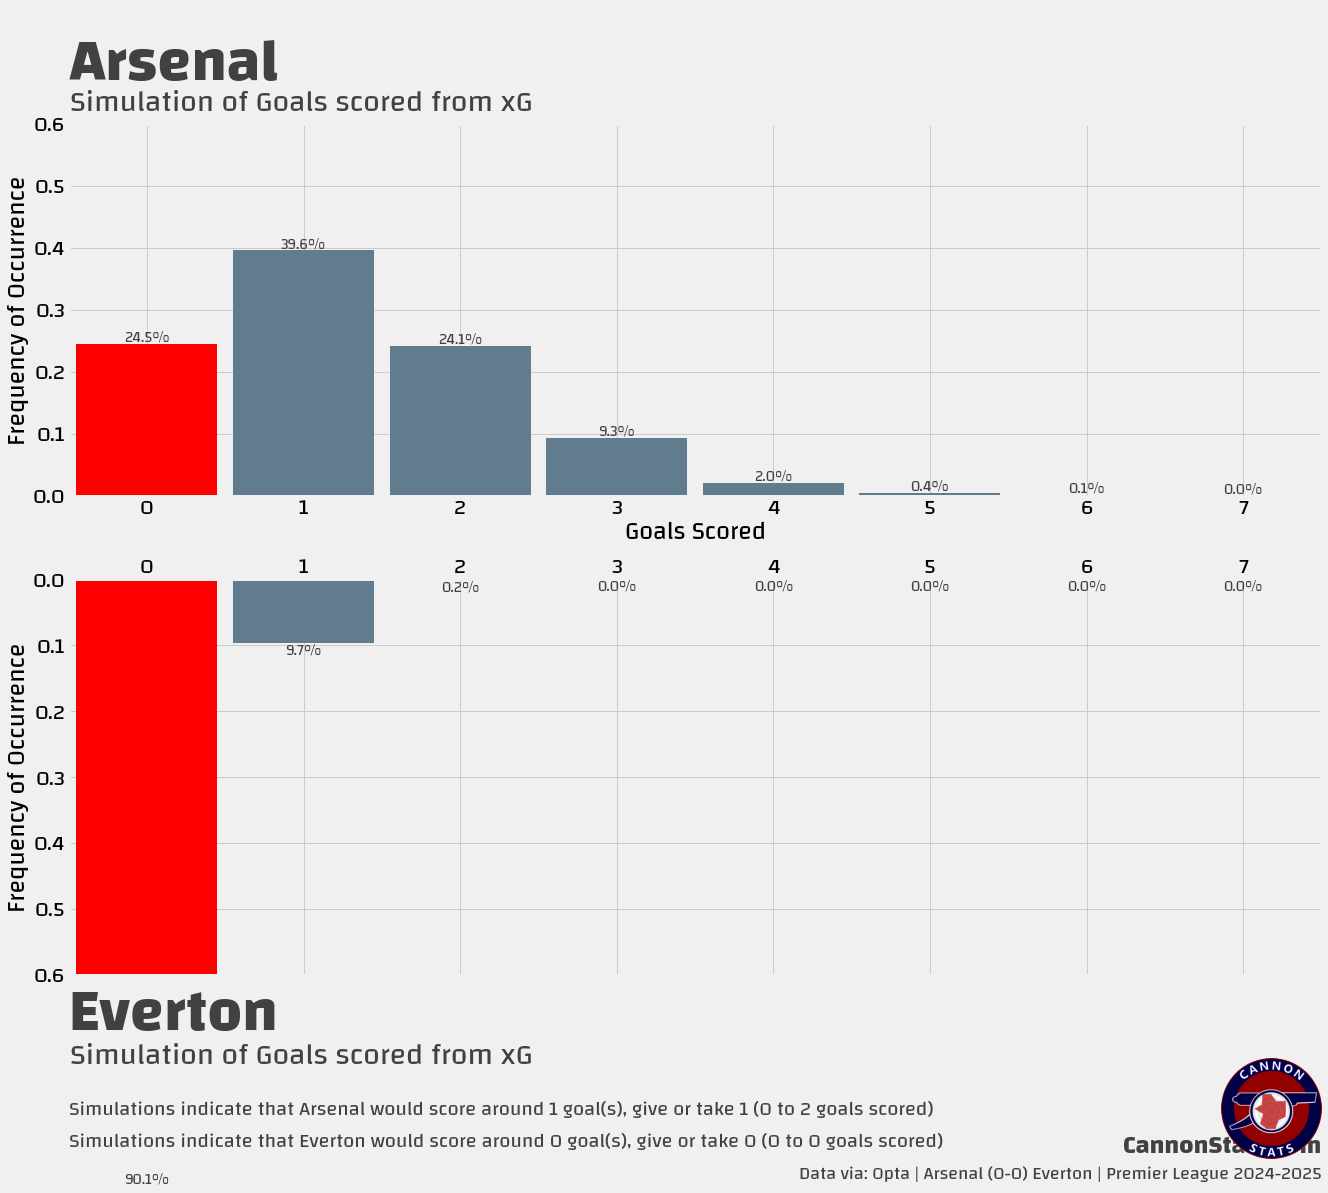
Arsenal 0-0 Everton
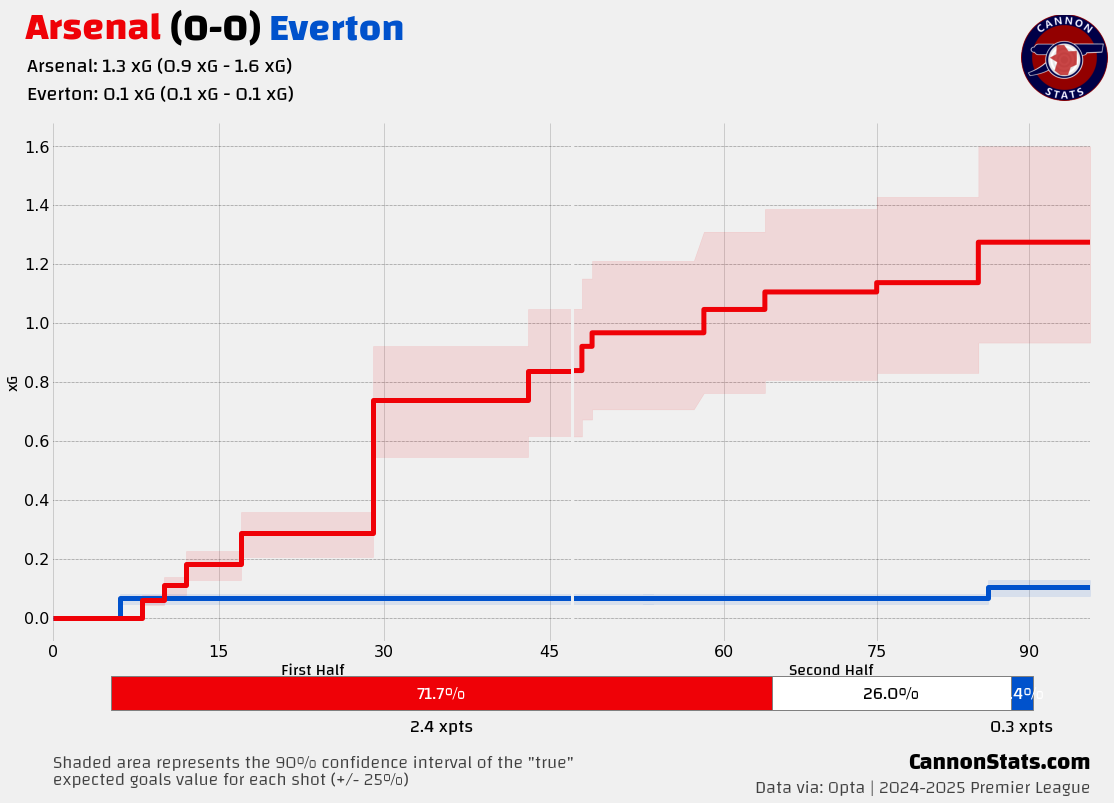
This was a dagger of a match for the hopes and dreams for Arsenal winning the title last season and was the first of the two 0-0 draws that Arsenal had last season. This result had Arsenal 6 points behind Liverpool, having played a game more and that gap felt (and with hindsight was) unsurmountable.
This was a tough set of dropped points overall because statistically Arsenal were much better than Everton but they failed to make it show here. This was also the second match in a row where this happened coming off of the Fulham draw the weekend before adding to the frustration in the fanbase.
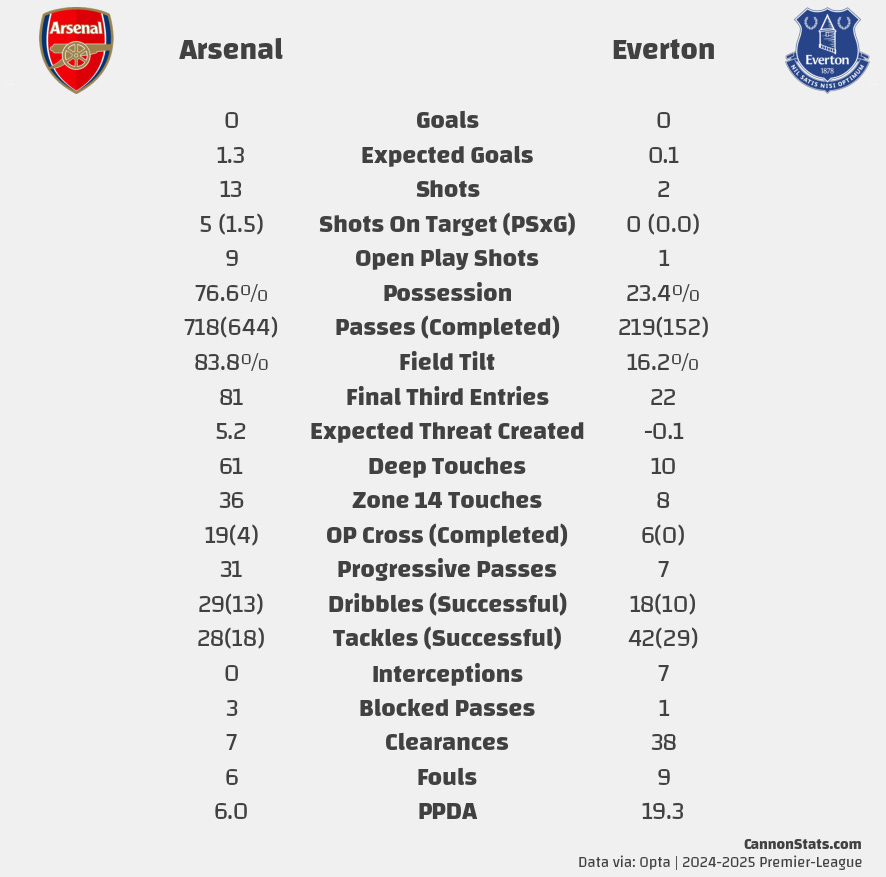
A few things that stick out here, Arsenal dominated basically all of the stats, but they only managed13 shots and 1.3 xG in this match. Having 61 touches within 25 yards of goal and only generating this level of shots is a tough look, especially considering that this was one of the handful of matches this season where Arsenal were able to play Martinelli, Havertz, Saka, and Odegaard all in the same team at the same time.

For an Arsenal team at home that is a low total for expected goals where they have averaged 2.02 per match at home over the last three seasons, and it ranks 13th out 57 Premier League home matches.
This match dovetails with the lack of overall attack in the final minutes of this match, Arsenal didn’t really create overwhelming pressure on Everton to where it felt like a winner was inevitable.
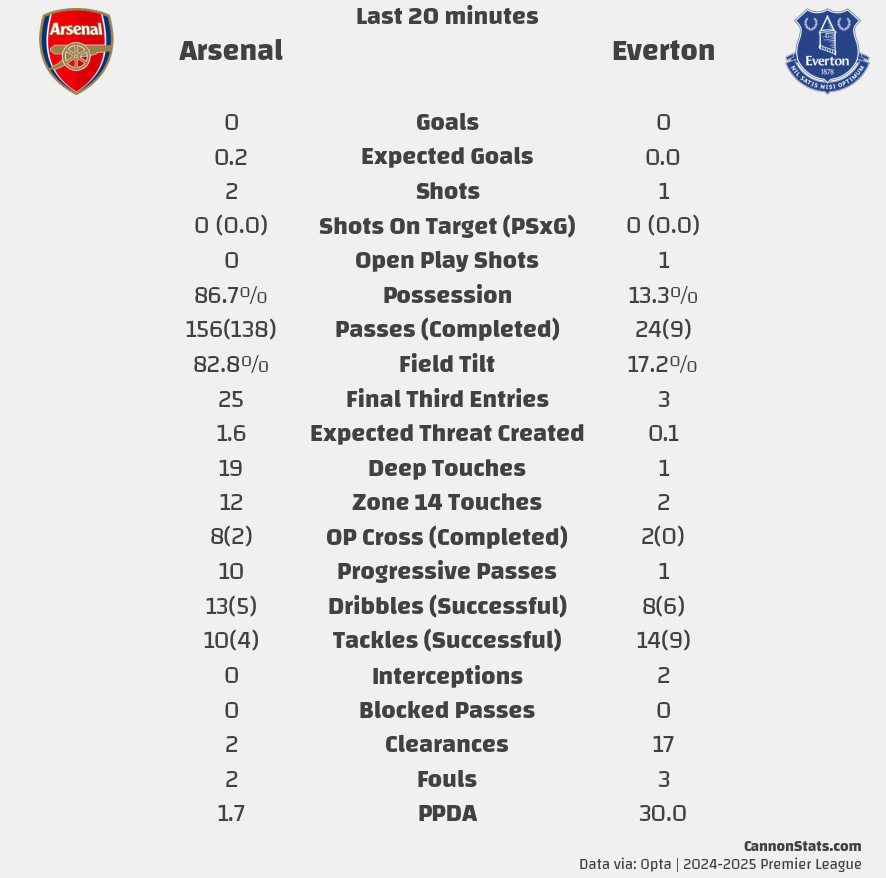
The final period matches the overall story the match, lots of the ball, even quite a bit in dangerous locations but a lack of the final action to create something from nothing or create the decisive golden chance to score.
This is perhaps a match where you could have said Arsenal did enough to win but it wasn’t such an overwhelming attacking outing that not scoring was a travesty.
Brighton 1-1 Arsenal
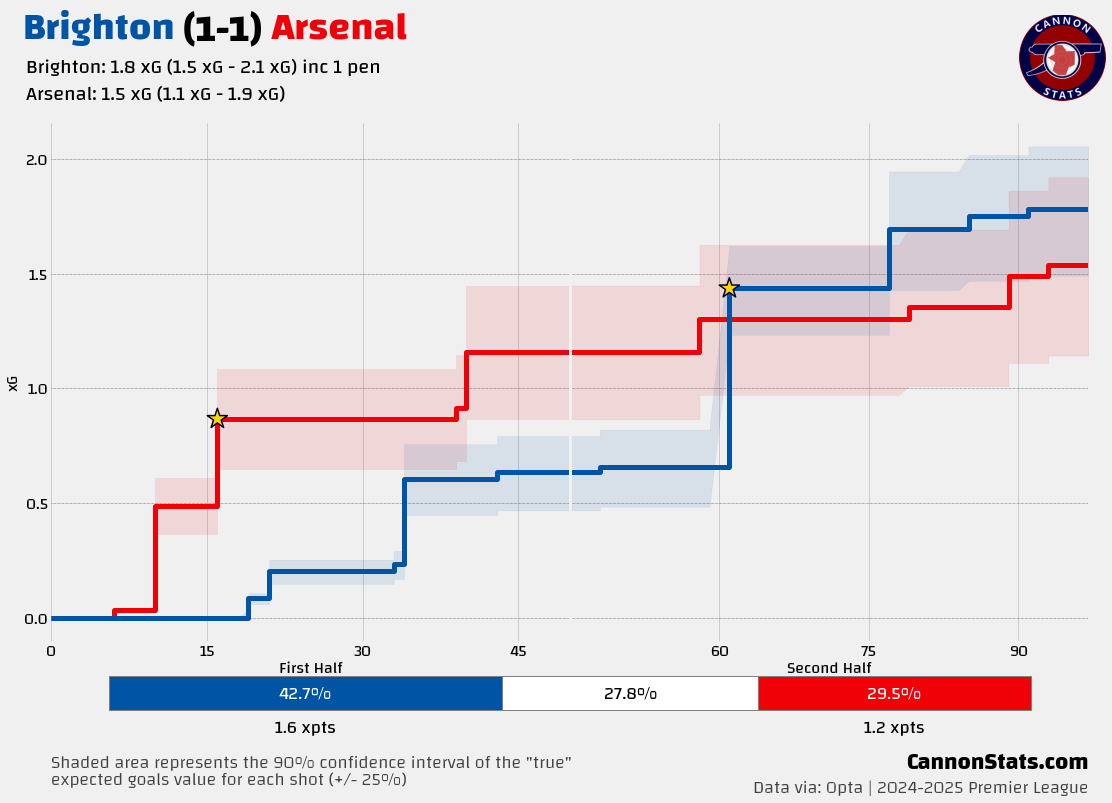
Another match where Arsenal scored first and failed to take all three points.
This match like the first Brighton faceoff was not without refereeing controversy. This is the match where William Saliba was judged to have fouled João Pedro on a clash of heads in the box and called for a penalty that was ultimately converted to tie the match.
This was a disappointing dropped points because of the referee decision made it feel like a robbery but there many of the issues that were present in the other matches showed up here as well. Arsenal were winning for 47 minutes in this match and in that time they had less possession than Brighton (48 to 52) and less field tilt (47 to 53), even more worrying is that the shots were 3 to 8 and it was 0.45xG to 1.5 (0.7 excluding the penalty).
The other reoccurring issue of not having anything left late to push on also made an appearance. Arsenal managed just 3 shots and 0.24 xG in the final 21 minutes of this match.
Arsenal 2-2 Aston Villa
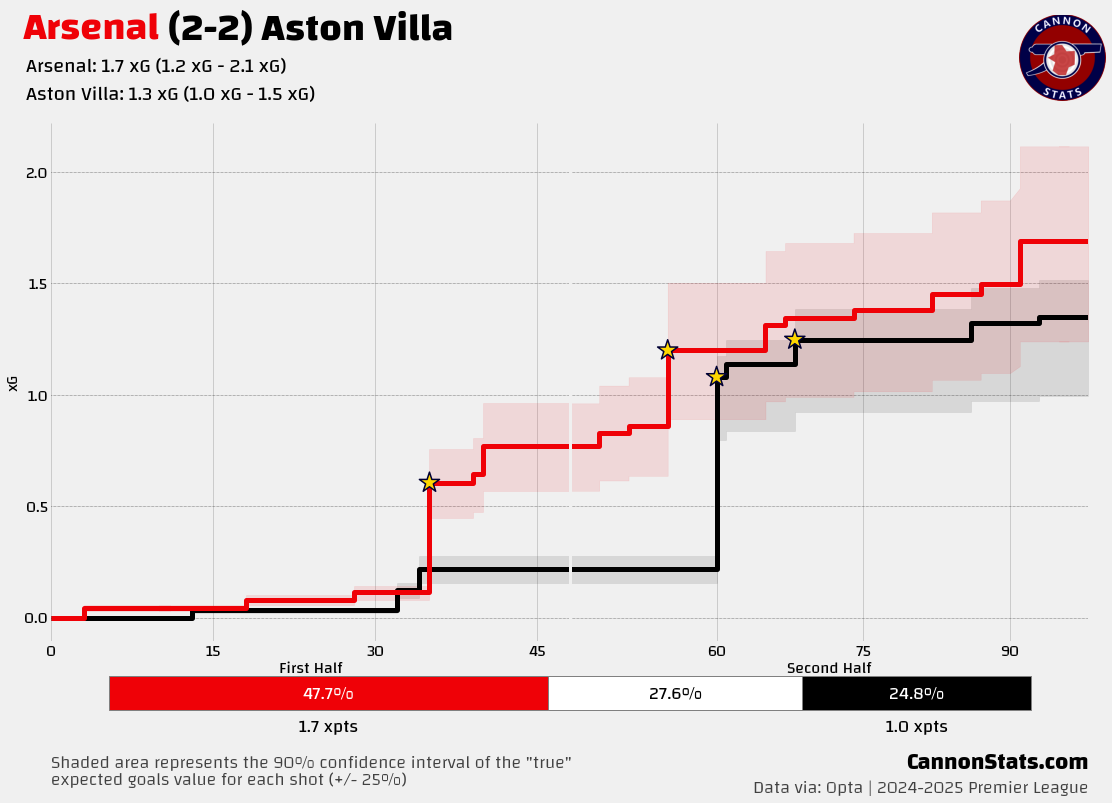
More dropped points from a winning position for Arsenal here. This time it was not the case that Arsenal got passive and failed to add on, in fact it was the opposite where they maintained possession and pressure to move from +1 to +2 and should have iced the match and the win.
At 2-0 Arsenal’s defending got a bit lax to allow a goal back. Aston Villa then got a second goal after a spell of Arsenal pressure (a positive) again from a defensive lapse.
In the 88th minute Arsenal thought they have a winner when a Mikel Merino’s shot was deflected in off of Kai Havertz Arm/Midsection but it was ruled out by VAR.
Overall, this was a match where many of the complaints and patterns this season in draws were not nearly as evident. Arsenal continued pushing after the first goal and got a second; after being pegged back Arsenal put Aston Villa under pressure and had late chances to win the game, it just didn’t work out this time.
Nottingham Forest 0-0 Arsenal
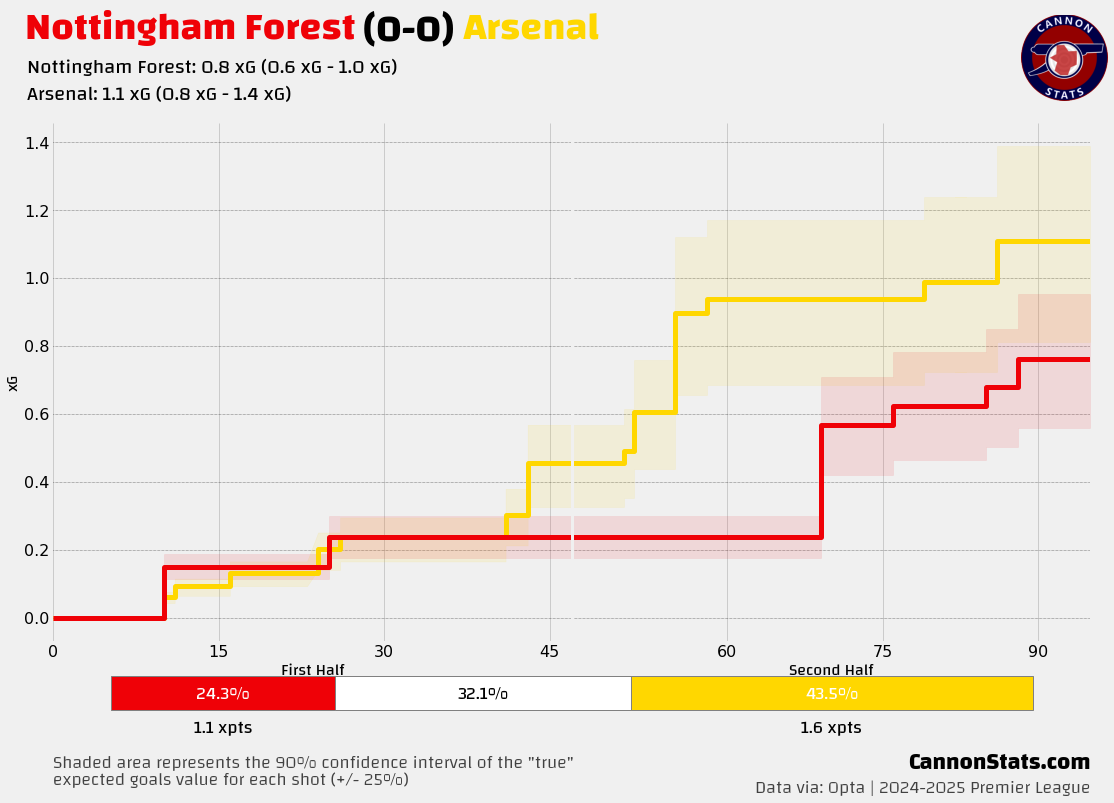
This match came in the middle of Arsenal’s attacking depth injury crisis. For this match Arsenal were missing Bukayo Saka, Kai Havertz, Gabriel Martinelli, and Gabriel Jesus, plus Myles Lewis-Skelly was suspended for a red card that he had picked up against West Ham.
Arsenal’s lack of firepower was apparent here as the team produced just 13 shots and 1.1 expected goals.
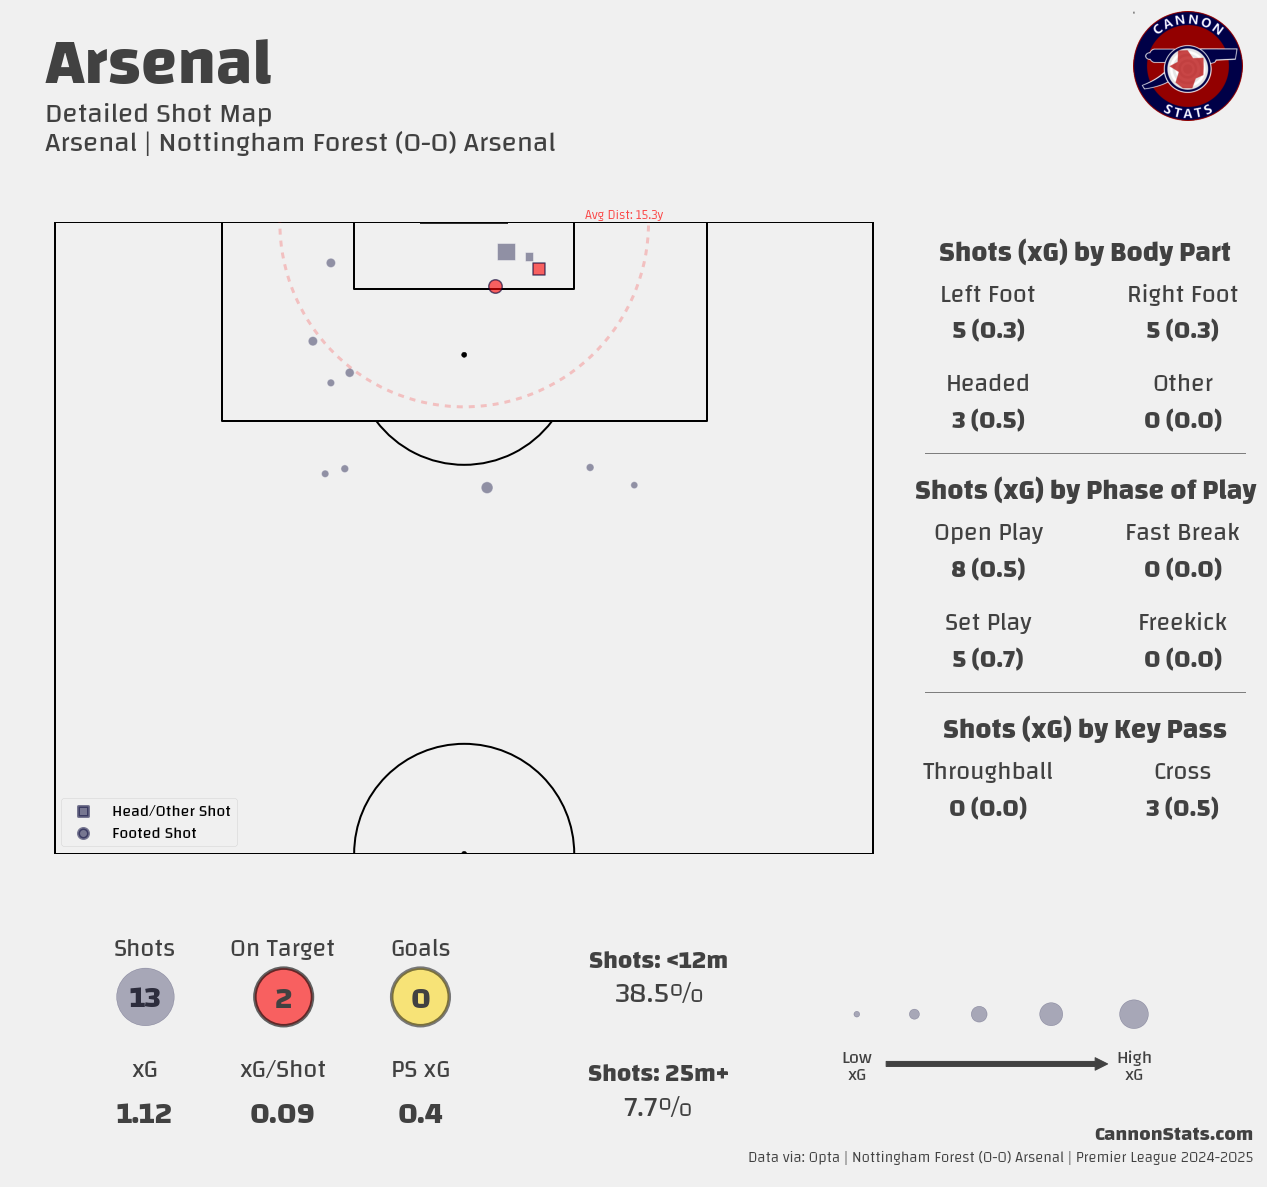
Nottingham Forest came into this match in third place and in a position where a single point was quite helpful for their goal of trying to hold on to the Champions League spots and played like it. They were content to stay in their block and try and pick their spots to counterattack but to focus on not losing.
This match was another in the pattern of Arsenal late in the match running out of steam as they again could not create enough pressure to find the late winner, producing just 2 shots in the final 30 minutes.
Manchester United 1-1 Arsenal
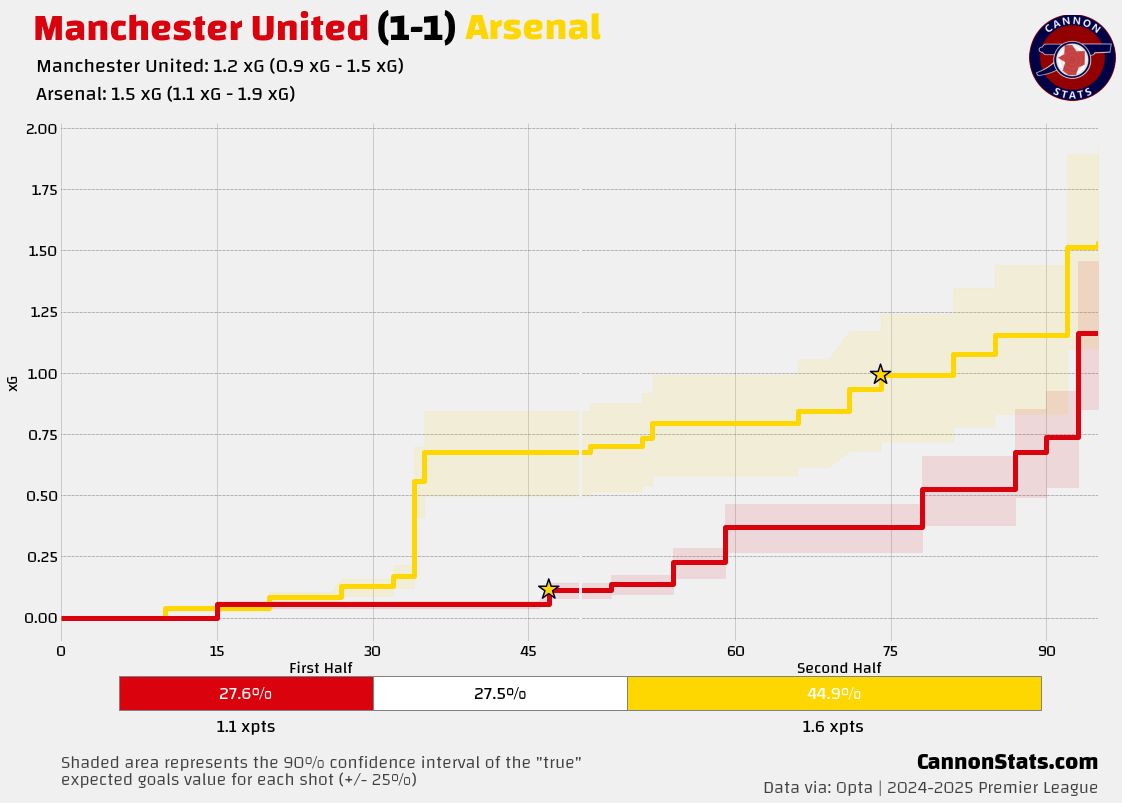
This match came on the heels of the Nottingham Forest draw sandwiching the big 7-1 win against PSV in the Champions League round of 16.
Arsenal had a positive first half here, dominating possession, field tilt and shots/xG but they failed to convert that into a goal and were sucker punched by a great Bruno Fernandes direct free kick to give Manchester United the lead. It was a bit of a repeat of some of the frustrating matches before it where Arsenal were the better team and maybe could have taken the lead but they were not so overwhelmingly better that it was certain (or bad luck if it didn’t) to take the lead.
In the second half of this match, Manchester United were able to play on the counter as Arsenal pushed men forward, nearly adding a second goal, needing good saves from Raya to keep Arsenal in the game. This made the game a bit scary because for as bad as United were, being able to generate counter attacks against Arsenal is just a fact of the universe. Arsenal were able to get an equalizer through an excellent Rice goal setting up a chance to push for the win.
This match overall bucked the general trend of problems in draws, that didn’t make it any easier to accept the result, but it is a data point that the team does not always suffer from the same issues.
Everton 1-1 Arsenal
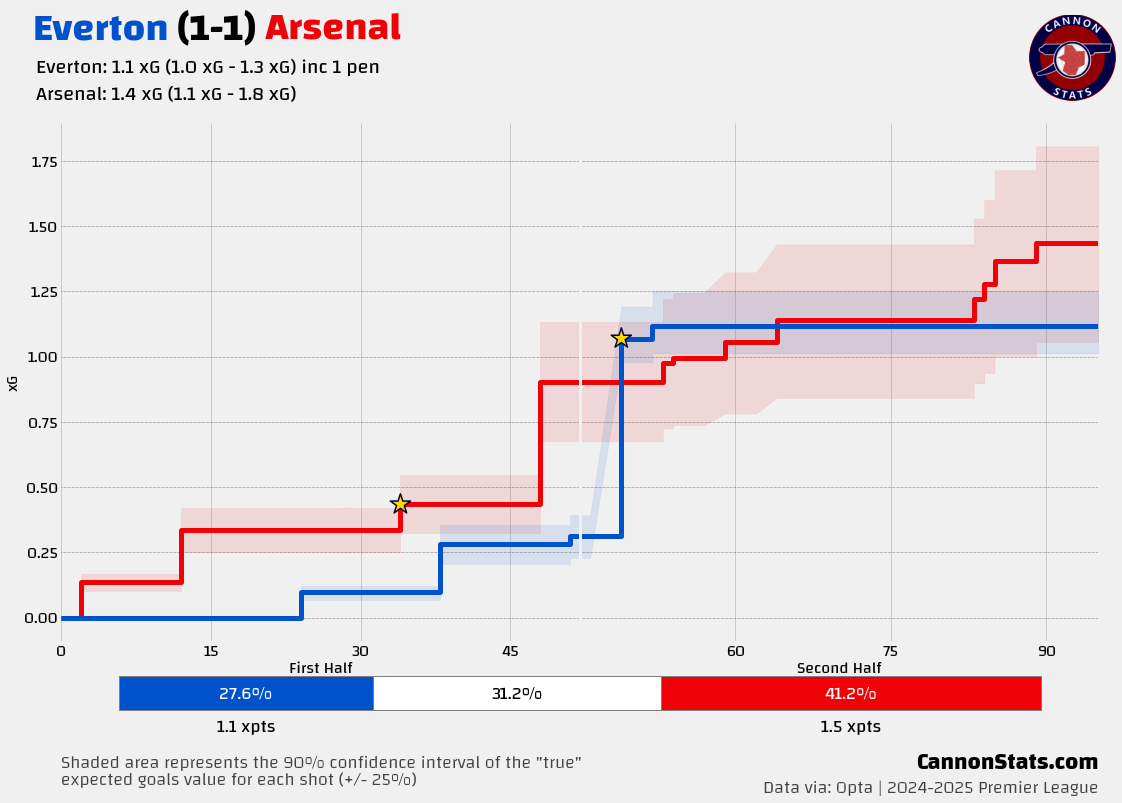
Another draw against Everton for the season, and another match with dropped points from a winning position (plus another disputed referee decision that went against Arsenal).
The focus for Arsenal in this match very well could have been on the midweek with the Champion League quarter final first leg against Real Madrid looming. Arsenal came in with a rotated team that had Bukayo Saka, Gabriel Martinelli and Martin Odegaard all starting this match from the bench.
Arsenal got the first half lead through Leandro Trossard in a first half that didn’t feature a ton of attacking highlights. Arsenal didn’t have a ton of time winning here in this match, but in that just over 15 minutes saw the measurables for tactics shift quite notably, possession went from 66% to 37%, with the shift in field tilt matching possession. I can understand not wanting to open up for a counterattack, but this was a not great Everton team that even rotated I’d expect Arsenal to be able to control and kill a game with the ball against.
The start of the second half saw Everton gifted a penalty that gave them an equalizer and after that Arsenal came back to struggling to produce much attacking threat to get back ahead. Arsenal did create some pressure late with all of the ball but they could not find a second goal.
Arsenal 1-1 Brentford
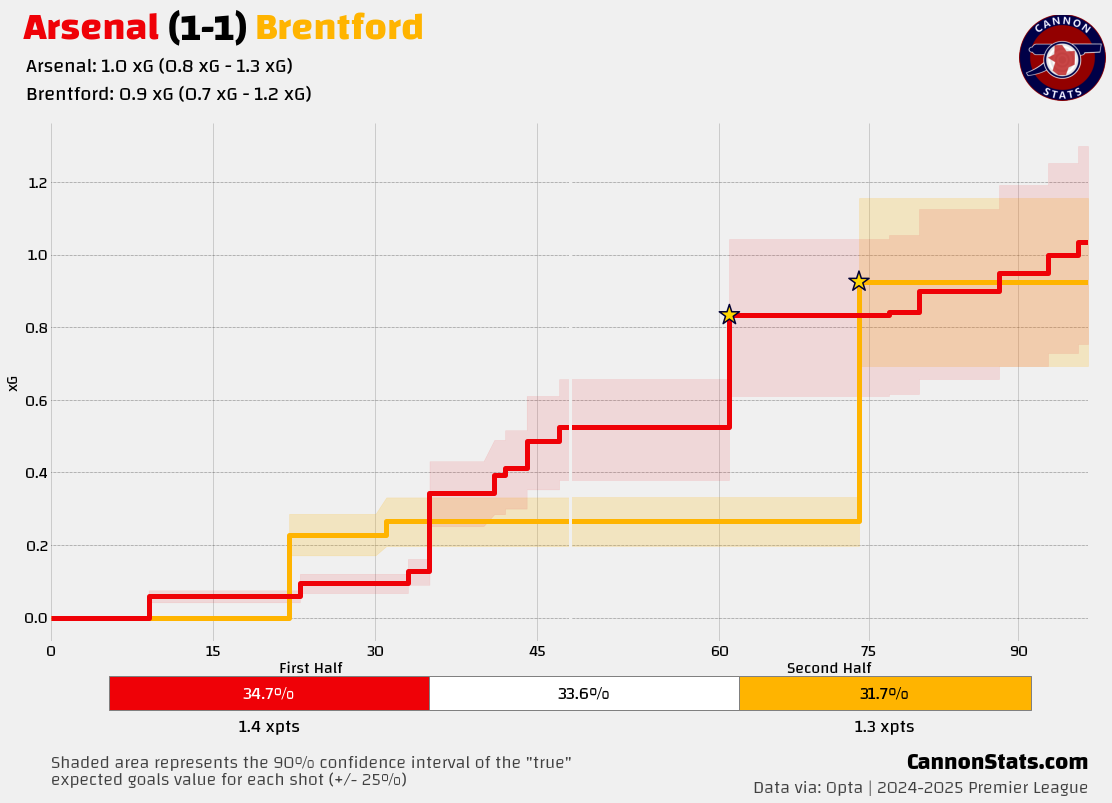
This match cannot be talked about without the mention that it came in between the Real Madrid matches. Arsenal were again rotated for this match without Saka and Odegaard and playing Kieren Tierney at left back, Oleksander Zinchenko in midfield and Thomas Partey at right back.
Arsenal had the ball in the back of the net in the first half, but it was offside. The pattern of Arsenal looking like they were better than the opposition but not overwhelmingly so repeated with a performance that could have been rewarded with a lead.
Arsenal started a bit slow in the second half but were able to score a well-executed counterattack from a corner kick that they were defending.
The length of time winning wasn’t massive here but some of the signs of being content up a goal were evident. Possession dropped from 64% to 58% and the team had 0 shots from 32 final third touches and 5 touches in the box.
After the equalizer, Arsenal came back to dominating the ball and applying pressure, but they could not create a clear opening from any of their final five shots (0.2 xG) and the points were shared.
Arsenal 2-2 Crystal Palace
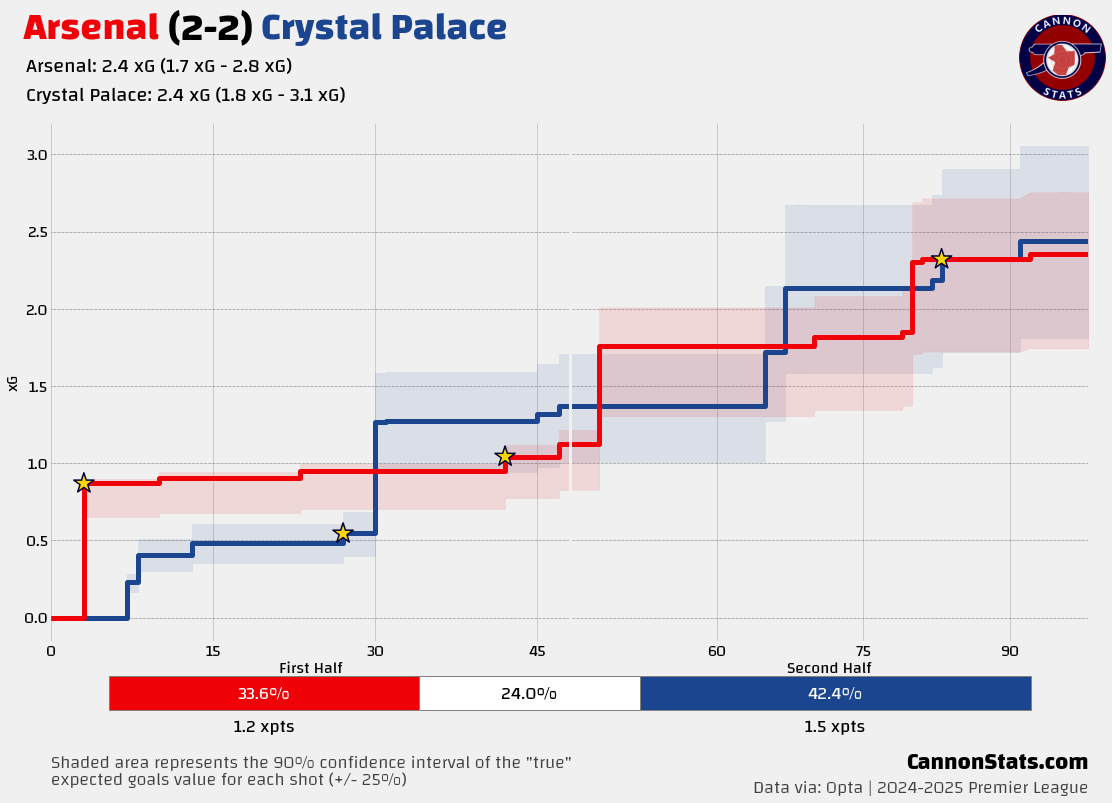
This match was moved forward to accommodate Crystal Palace playing in the FA Cup semi-final at the weekend, this was also a week before Arsenal would be facing PSG in the Champions League semi-final. The relative importance of those other matches for both teams seemed to play a role in the overall quality of this match.
This match was back and forth and never featured the patented control that we expect from Arsenal under Arteta. Some of this was down to Arsenal scoring in the opening minutes but it was also a reflection of the threat that Crystal Palace posed in this match, which was quite substantial, and an outlier compared to most teams that come to the Emirates.
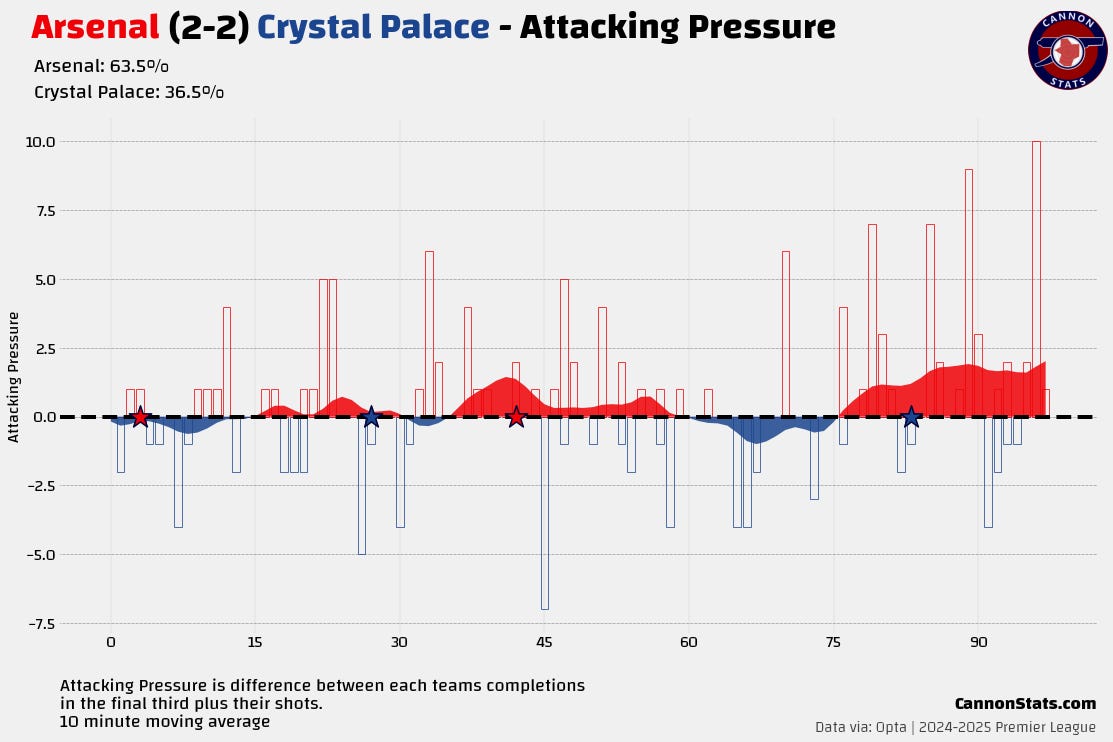
Arsenal were never able to get that strangled hold and over and over again Crystal Palace were able to cause problems. It’s not often over the last few years to see a team able to create more of the territory-based threat than Arsenal but that is exactly what happened here.


This match in contrast to others that we have looked at here was less that Arsenal got passive and caught when they took the lead and more that Crystal Palace caused Arsenal issues.
At 2-1 Arsenal did quite well to push for a third creating nearly 1.5 expected goals and seemingly had an icing goal but they were denied by the ball being just over the line for a goal kick and forced some good saves by Dean Henderson.
The equalizer that Arsenal did concede here to Crystal Palace was from an error by Saliba that Mateta chipped in and it was too late for Arsenal to find a third goal.
Overall, this match was quite unique among the draws that Arsenal had last season and didn’t fit neatly into the established patterns.
Liverpool 2-2 Arsenal
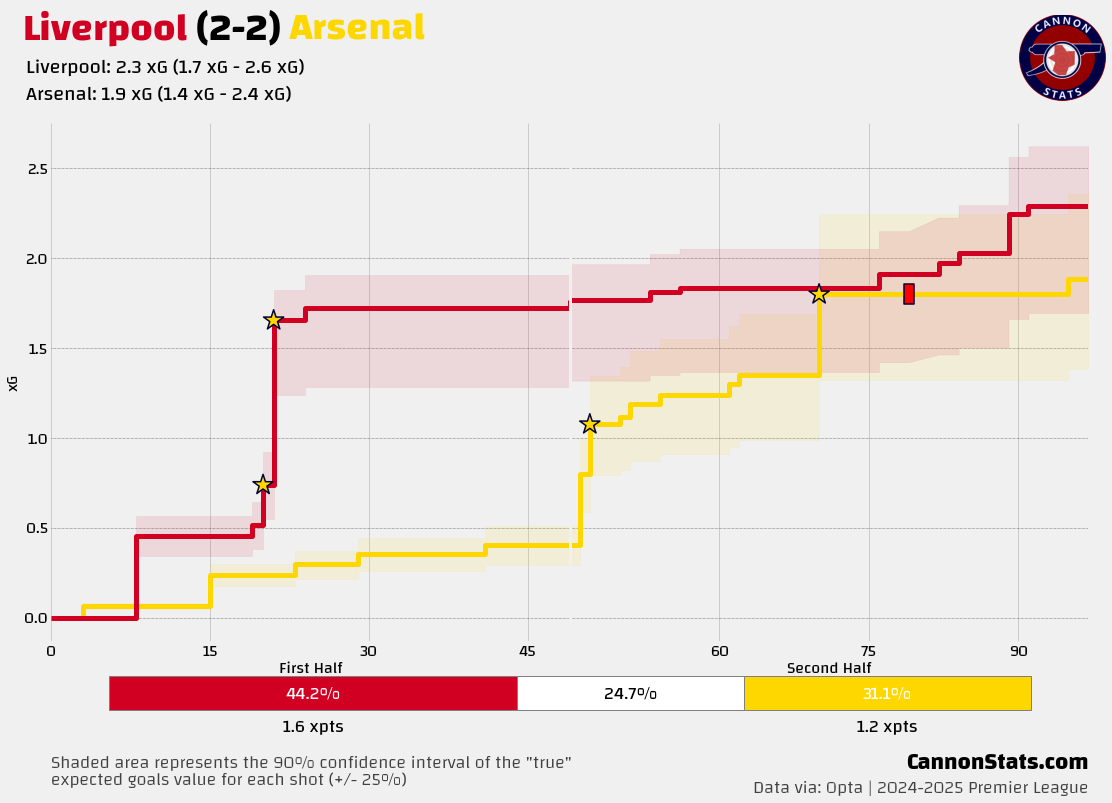
This was the final draw for Arsenal of the season, and this is one where you could probably feel the happiest about it as a fan when the final whistle blew.
This match didn’t have a ton at stake with Liverpool already Champions and Arsenal all but guaranteed to finish in the Champions League spots but there was pride on the line, and a bit of that need to measure up against the team that Arsenal thought they should have been closer to in the title race.
Arsenal had more of the ball early here and did well to create a few openings but we also got to see Liverpool at their transition/quick attacking best.
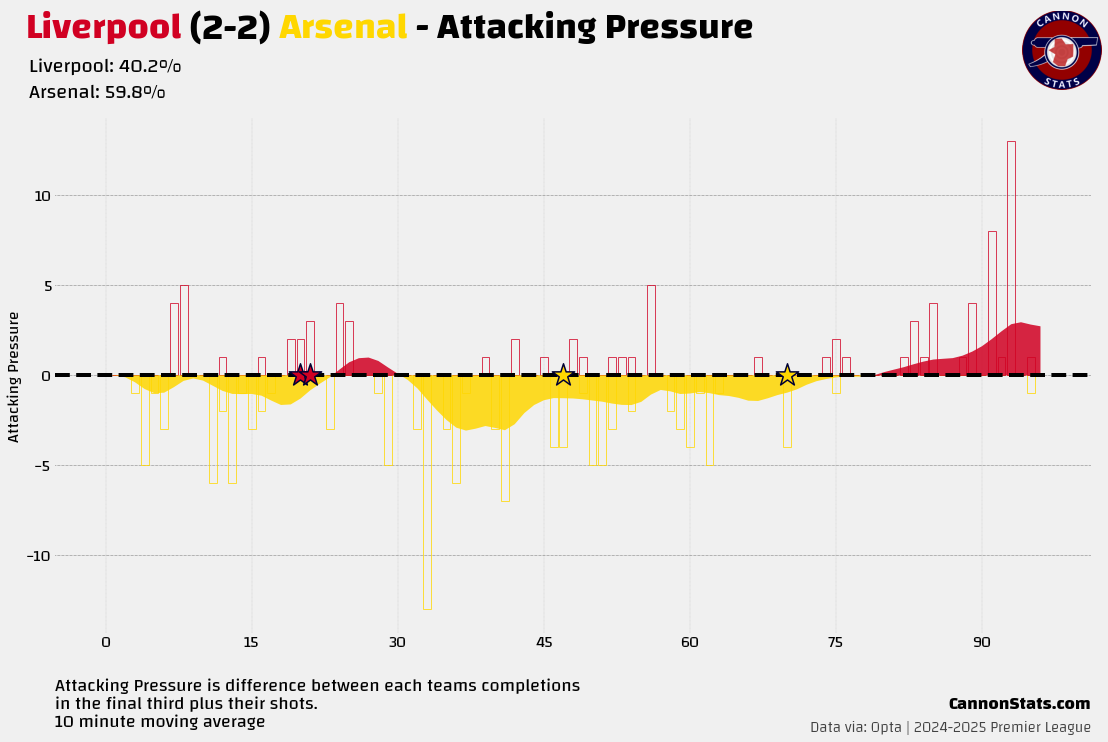
They scored two rapid fire goals and it looked like it might be big trouble for Arsenal’s unbeaten record against the other big six teams as they had opportunities to push it to three in the first half.
The second half was significantly better for Arsenal as they regained control and were able to create their own threat against Liverpool. It took until the 70th minute but Arsenal’s continued ratcheting up of pressure paid off with them getting level.
For Arsenal and this analysis, it ended when Merino was given a second yellow card in the 79th minute and Arsenal switched to a defensive mode, doing just enough to see out not losing. Like the Crystal Palace match that preceded it, this match doesn’t share a lot of similarities to the other draws this season and the late red card makes it more like a match that we should set to the side.
Final Thoughts
There is a saying that Clive Palmer likes to repeat about Arsenal’s play, “the team plays 2-0 football at 1-0 up.” I think that is too often an apt description for the matches that end in draws. That was one of the themes that seemed to come back again and again looking back at the draws in detail.
We need to be careful to not get too laser focused on some of the conclusions and stray into results-based analysis while only looking at the matches that ended in draws here and ignoring the times that the team did go on to actually increase the lead or were able to preserve the win.
The other worry is that the samples that we are dealing with are not large enough (just under 1,000 minutes this last season) to where we should feel comfortable drawing large sweeping conclusions.
It is a bit surprising and against the narrative but also a reminder again how these small slices can be tough to read too deeply into, that at the +1 game state and with both teams on even strength Arsenal were the team that created the most expected goals per 90 last season and had the second-best expected goals difference.
Over the last three seasons Arsenal have produced the following at the +1 game state with no man advantage and the rank in the League:
24/25: 1.96 xG per 90 (1st), 1.18 xG against (10th), 1.33 goals per 90 (8th), 1.33 goals against (13th), +0.79 xG difference (2nd), 0.00 goal difference per 90 (10th)
23/24: 1.51 xG per 90 (7th), 0.69 xG against (1st), 1.58 goals per 90 (6th), 0.84 goals against (4th), +0.83 xG difference (5th), +0.74 goal difference per 90 (3rd)
22/23: 1.59 xG per 90 (7th), 1.11 xG against (9th), 1.99 goals per 90 (4th), 0.90 goals against (6th), +0.47 xG difference (7th), +1.09 goal difference per 90 (3rd)
Looking at three seasons here for this game state and I can still see that “2-0 football at 1-0” type production in these numbers. At that even game state Arsenal have repeatably been one of the strongest teams over the last three seasons ranking 2nd, 1st, and 2nd but there has been a drop off when the team gets the lead.
That didn’t hurt nearly as badly in 23/24 or 22/23 because the variance/finishing went the team’s way.
To help put this a bit more into context, let’s take a look at how this compares with the two teams that Arsenal has been in the title fight with over the last three seasons at the top of the table.
Manchester City over the last three seasons:
24/25: +0.41 xG difference (4th), +0.6 goal difference (3rd)
23/24: +0.86 xG difference (4th), +1.15 goal difference (2nd)
22/23: +1.13 xG difference (2nd), +1.47 goal difference (2nd)
Liverpool over the last three seasons:
24/25: +0.88 xG difference (1st), +0.60 goal difference (2nd)
23/24: +1.35 xG difference (1st), +0.54 goal difference (6th)
22/23: +0.71 xG difference (4th), +1.05 goal difference (4th)
The elite production at the even game state has put Arsenal into winning positions more often than other teams over the last three seasons and then positive variance from good but not great production helped to make sure that the team didn’t get pegged back as often as perhaps they could have in 22/23 and 23/24. This last season we saw what happens when that turns and it means lots of dropped points. Variance will happen; you can see that in City and Liverpool’s numbers as well but being able to continue to perform at a level that is at the top of the table will help cover for it.
One of the other trends that came up for Arsenal in their draws was that they team was not consistently able to generate the waves of attack that often accompany a big team pushing for a win while they are tied late in games.
Here is how it looks for each of Arsenal’s matches that ended in a draw this season.3
This is again tough because we are taking a slice of the season with the outcome of no goals being scored already being a key factor and cutting the sample size down to just over 200 total minutes. This makes it so our uncertainty is quite high on how much we should expect this to tell us about the true talent level of the team in these spots and saying anything about the future performance, but it can be helpful in describing why the draws happened specifically here, in this season.
There were a handful of matches where the volume of shots and the total xG was high enough that scoring wouldn’t have been a shock, but these matches were generally the exception last season.
This feeds back into a bit of the larger overall problem that Arsenal faced last season where the team’s depth was stretched and that exposed the team’s ability to change the game from the bench or simply last 90 minutes at the highest level twice a week.
For the first 75 minutes of games, Arsenal were one of the strongest teams in the League.
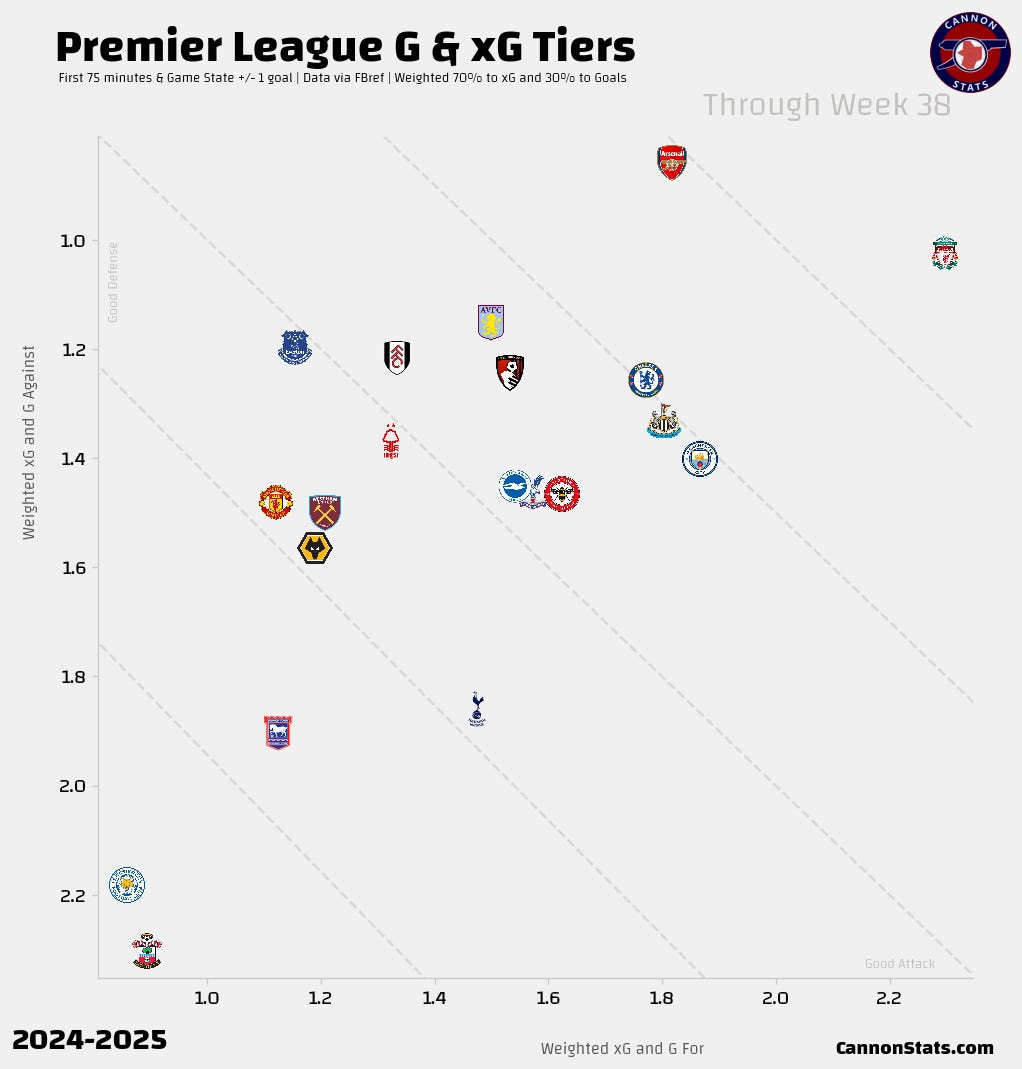
The team developed a reputation for a mediocre attack last season, but for the first 3/4 of games they performed better than all but Liverpool and Manchester City and paired that with the best defense in the League.
It was in those closing minutes of games where Arsenal’s performances fell way back, especially at generating chances.
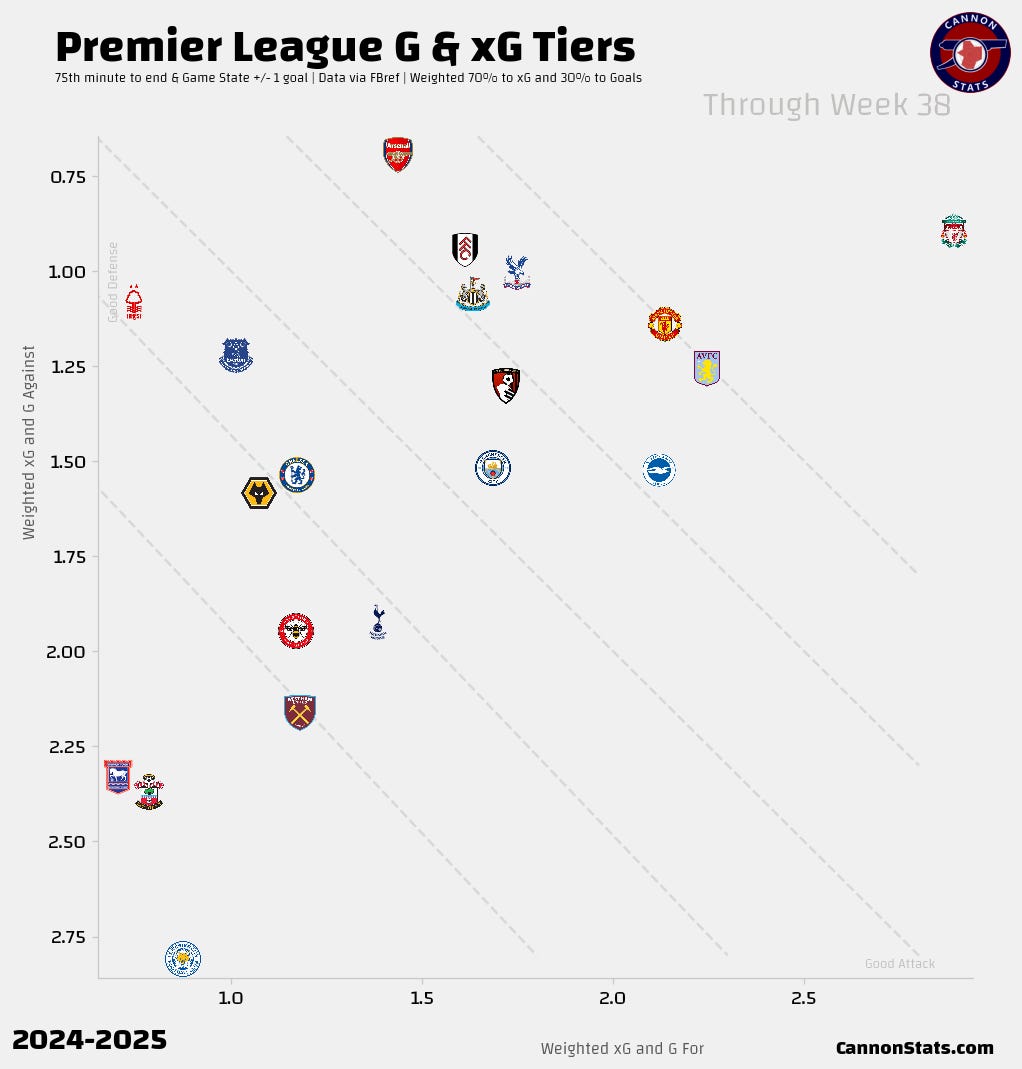
Arsenal went from 3rd in xG and goals to 10th in xG and 11th in goals scored from the 75th minute to the end of matches. The strong defensive numbers kept Arsenal’s overall difference numbers respectable at 5th and 6th respectively, but this was clearly a weakness for the squad last season and a major contributing factor to the team having to settle for a single point so often.
Outlook for the coming season
The last thing for this analysis is basically saying “well so what can be done about it?”
The first thing that Arsenal have done is that they have spent money looking to improve the overall attacking talent that is available to the team. Arsenal did not have a bad attack last season, that was evident when the team was healthy or even when they were still in the early phases of the game before exhaustion set in, but it was a thin attacking group, and a cluster of injuries exposed the problem for all to see.
The additions in attack that Arsenal have made so far (eternally optimistic) have added the most prolific scorer in Europe and one of the best 1v1 wide attackers to the group. At a minimum that gives the teams needed options off the bench and potentially upgrades on the players in the first team. The new players create a larger group with a more diverse set of skills that should give Arteta flexibility to tweak things when faced with a defense that is set up to slow down Arsenal’s “plan A” attacking patterns or it is just not the day for a player.
This should directly address the issues of running out of steam late in games or when Arsenal were forced to turn to the backups during the injury crisis that so often caused Arsenal’s attack to sputter and run out of ideas last season.
What I am less certain of is that there will be a change away from some of the conservative nature that always seems ready to seep into Arsenal’s play under Arteta.
The cause of this is not easy to pin down, from the outside it is impossible to know if this is an instruction from the coaching staff, if it is something the players are doing, or if it is just a bit random noise and we are looking for a pattern that can explain things.
One potential explanation that has stuck in my mind after last season is that this move towards safety in game is tied to the team being thin with numbers and overworked.
The team would often perform to the usual levels early in matches (as we have seen above for the first 75 minutes data) and succeed taking the lead in matches. Afterall, Arsenal managed this in 30/38 matches last season which shows that for all of the complaints and harping on the issues about the team it was still quite good and capable. My hypothesis here follows that after having expended the energy generating the lead, there was a subconscious collective feeling of “job done” that let the players drop off from continuing to press, attack, and do the high effort job that Arteta’s system at its best demands to the same level. Arsenal have an elite defense and out of possession system and it could be only natural for there to be a thought of relying on their ability to defend and stop the opposition to see them through.
This is speculation on part but if it is also the case, this is something that is addressed with the addition of more attacking depth. A team that is fresher and with hungry players on the bench can continue to push and give the high levels of effort to max out the Arsenal level.
If that is not the case (or even if it is), hopefully Arsenal’s analysts have done the work similar to this but more in depth, to help develop lessons learned from last season to adapt the game model. One of the key learnings led by analytics of the last 10-15 years is that moving from +1 situations to +2 and beyond game states drastically increases a team’s ability to convert matches into three points and in the course of a season can add significantly to a team’s points tally.
Arsenal’s base tactics already include one of the strongest defenses in the world and more often than not they do not need to tilt things even further in that direction when they go up a goal.
Let’s watch and see how the upcoming season develops, looking at this team I don’t think that there is an inherent issue that makes them more prone to drawing and it will be nice to test that.
If you are counting and see 15 draws instead of the actual 14 here you are correct, Arsenal’s 2-2 draw with Manchester City was both recovering from a losing position at 0-1 down and dropping points from winning position at 2-1 up. They are counted in both sections here for this even though it is just one draw on the end points tally.
Manchester City lead over the last 3 seasons at 1.4 points per time falling behind, Liverpool are tied with Arsenal at 1.2. No other team has broken 45% of deficits turned into points over that span or earned more than 0.8 points per time falling behind.
The first Arsenal 2-2 Liverpool draw has fewer minutes included here because Liverpool scored after the 75th minute to tie the match.
Thanks Scott. Worth pointing out that we created and scored a good xG chance vs Fulham that was ruled out for a marginal/non impactful offside (eg Martinelli gained no advantage).